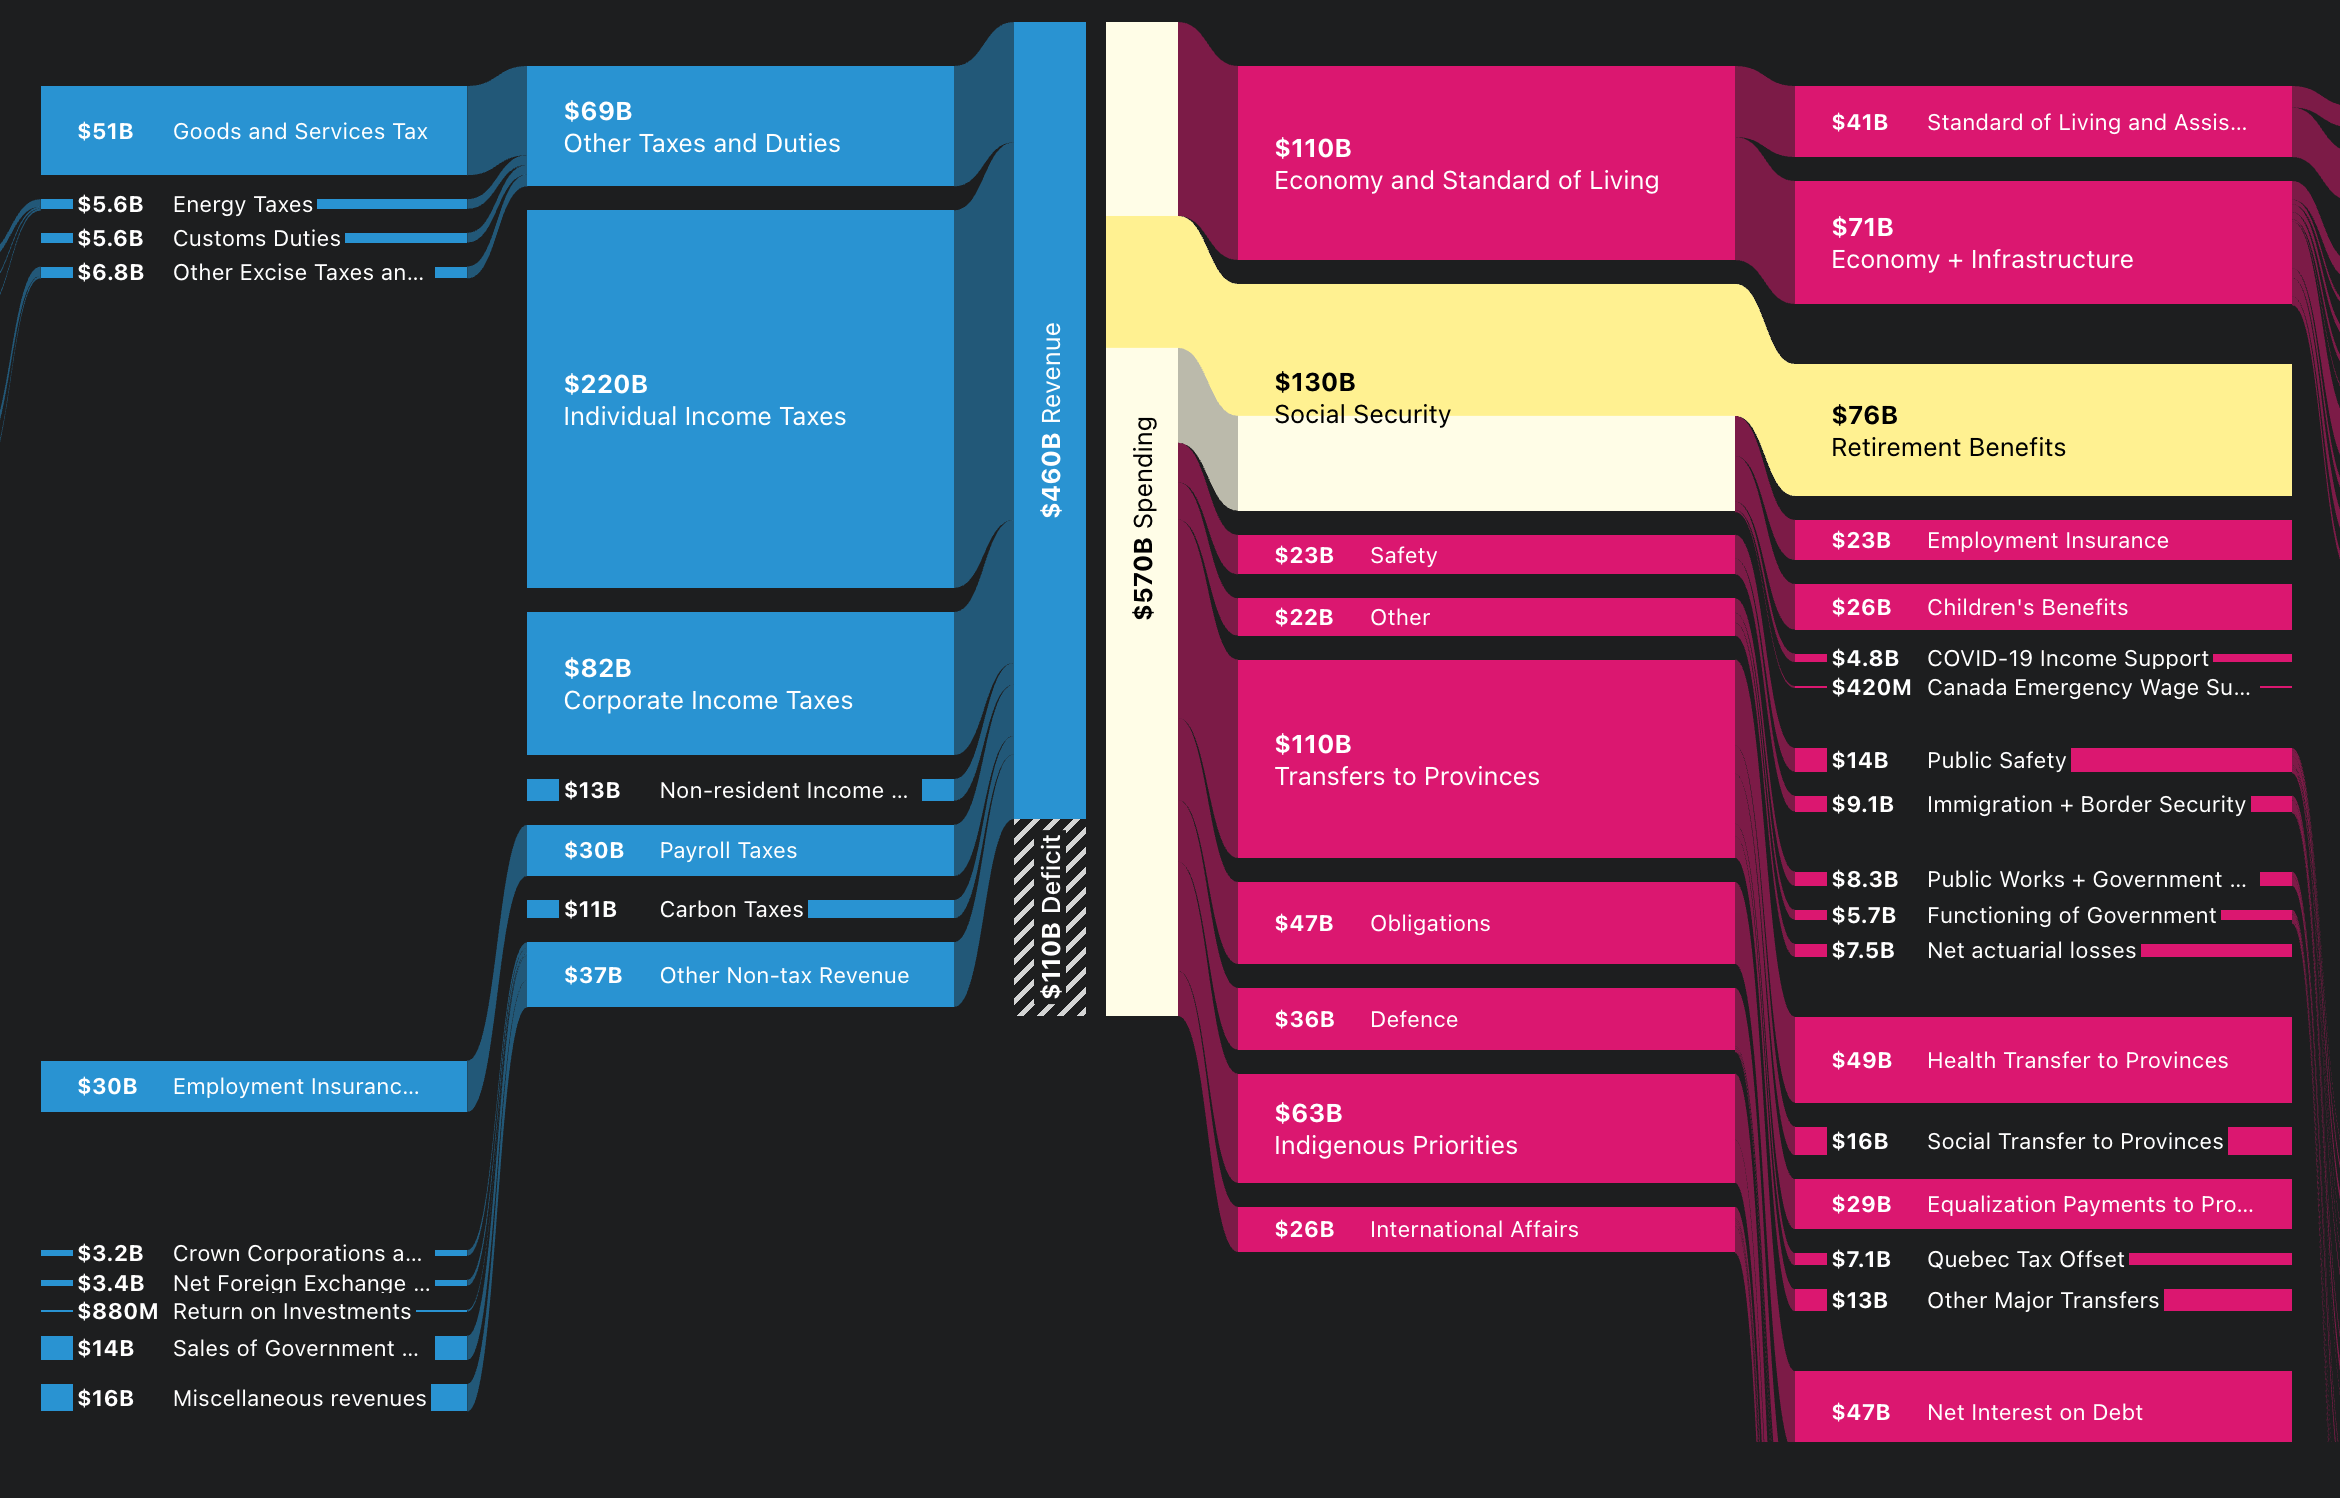
Government Spending Visualization
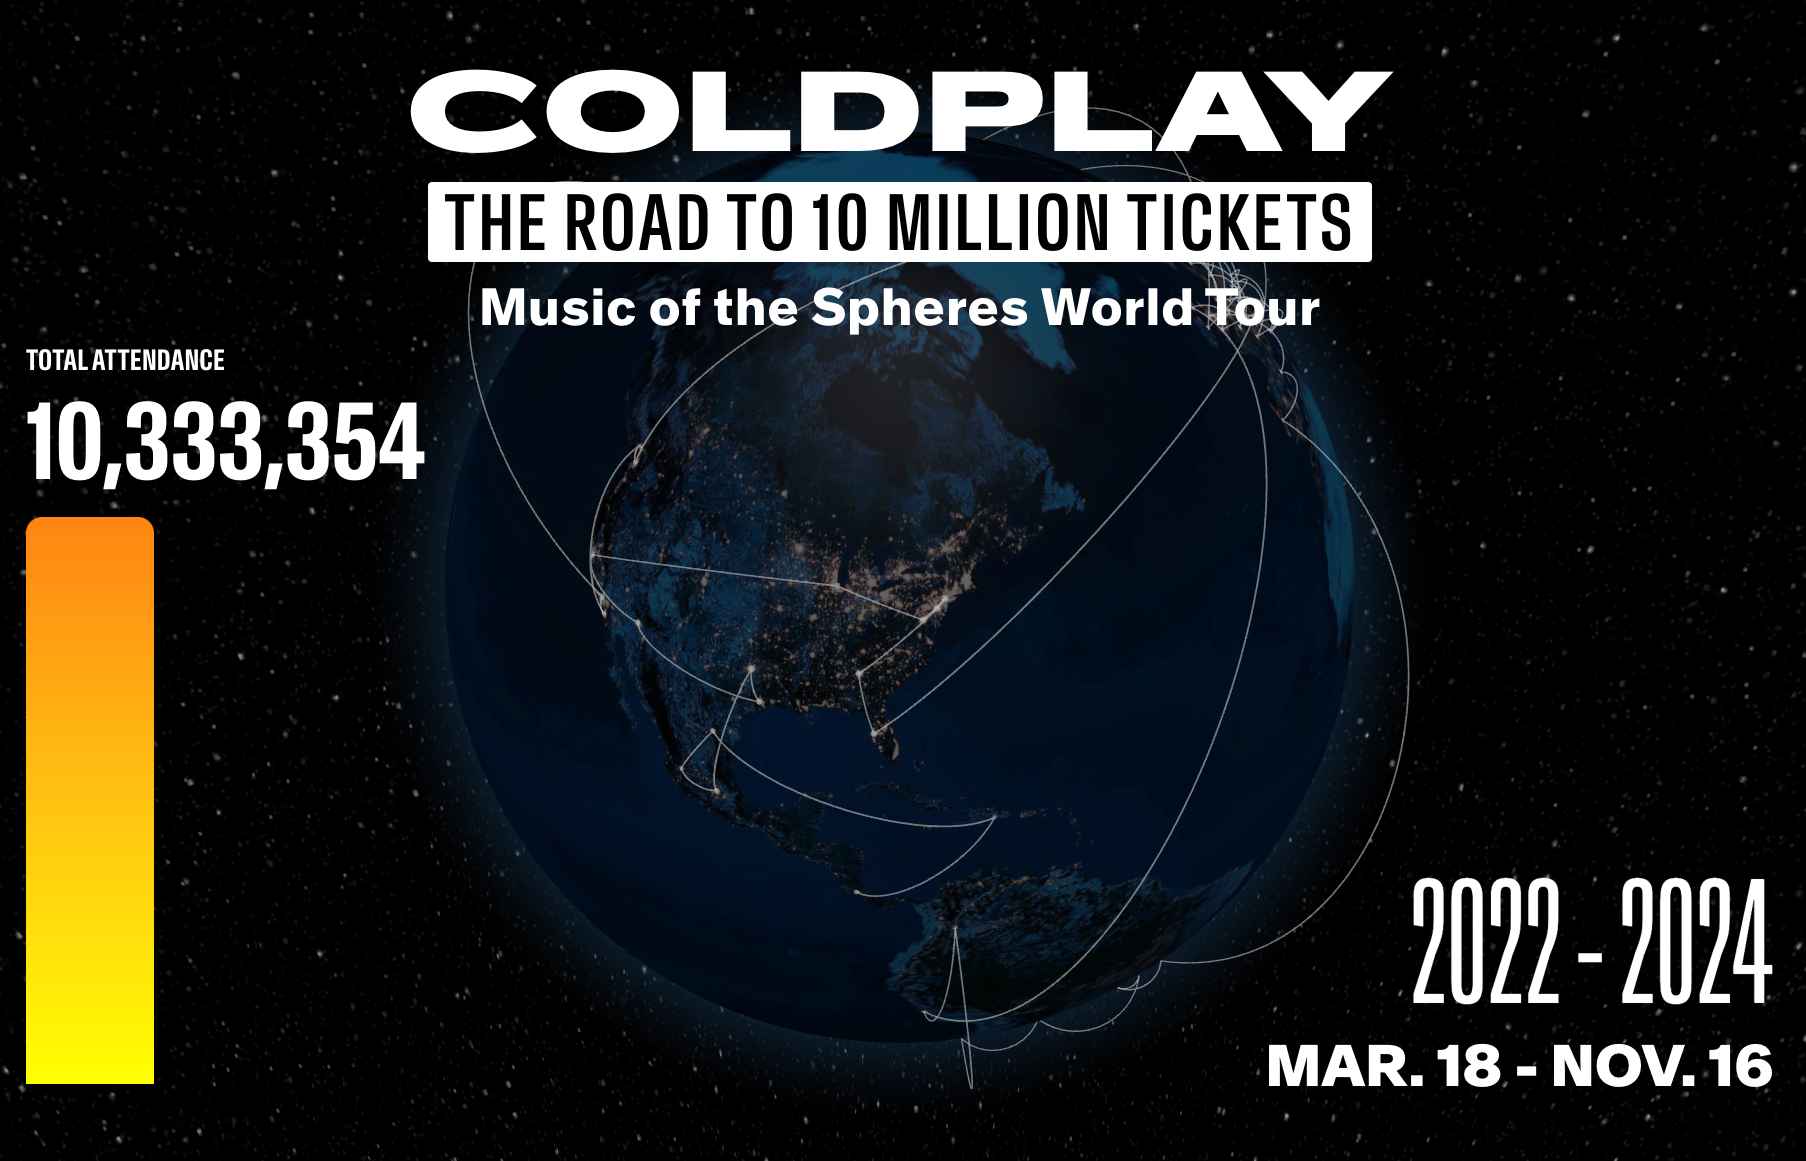
Coldplay's Music of the Spheres World Tour Visualization
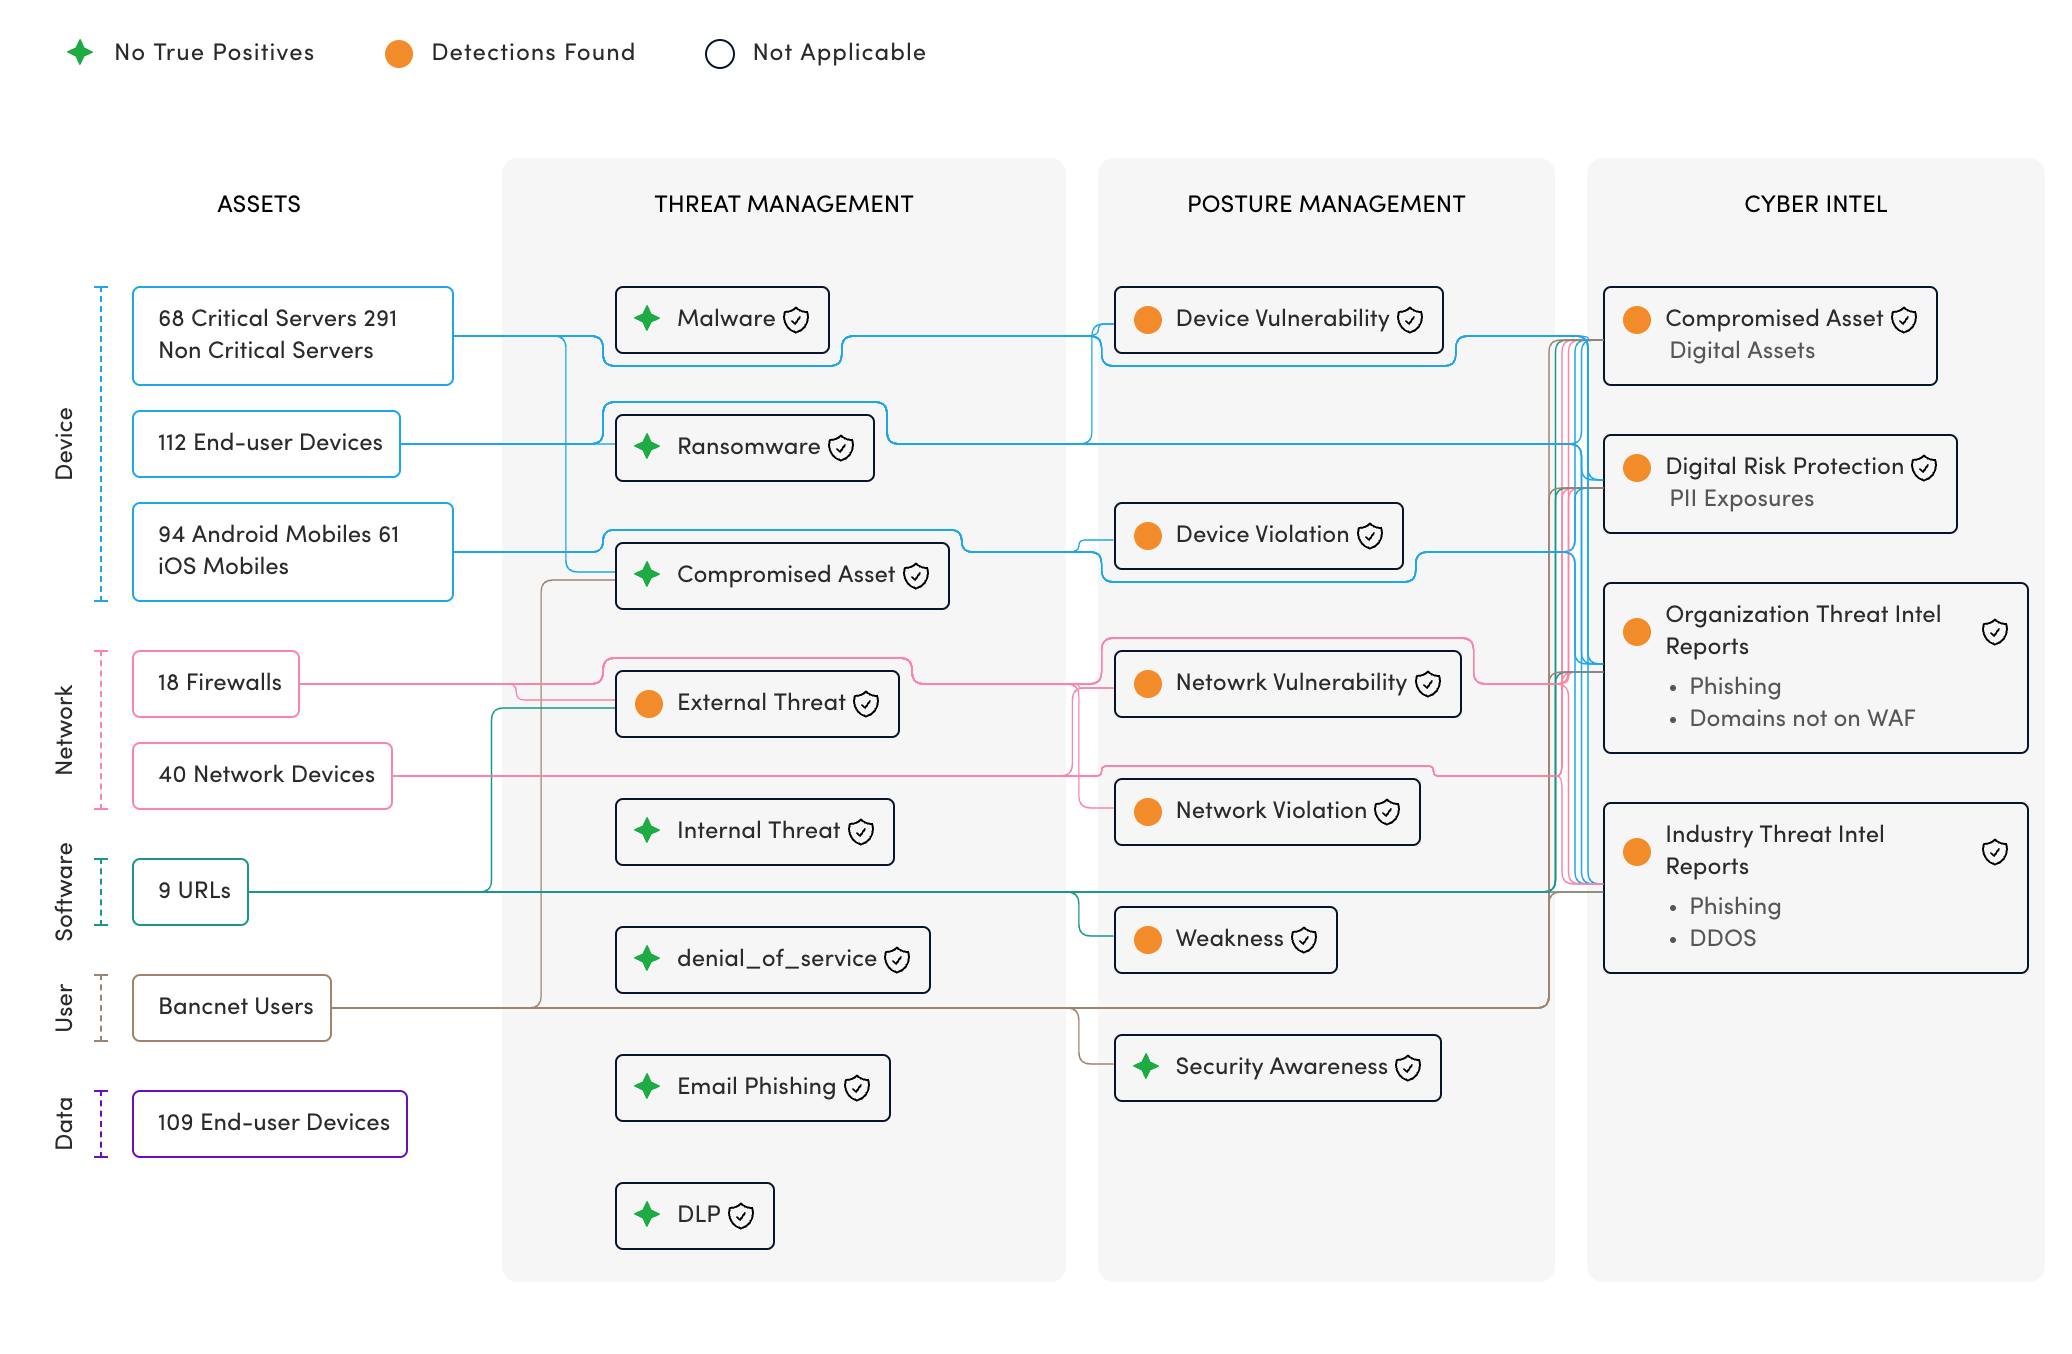
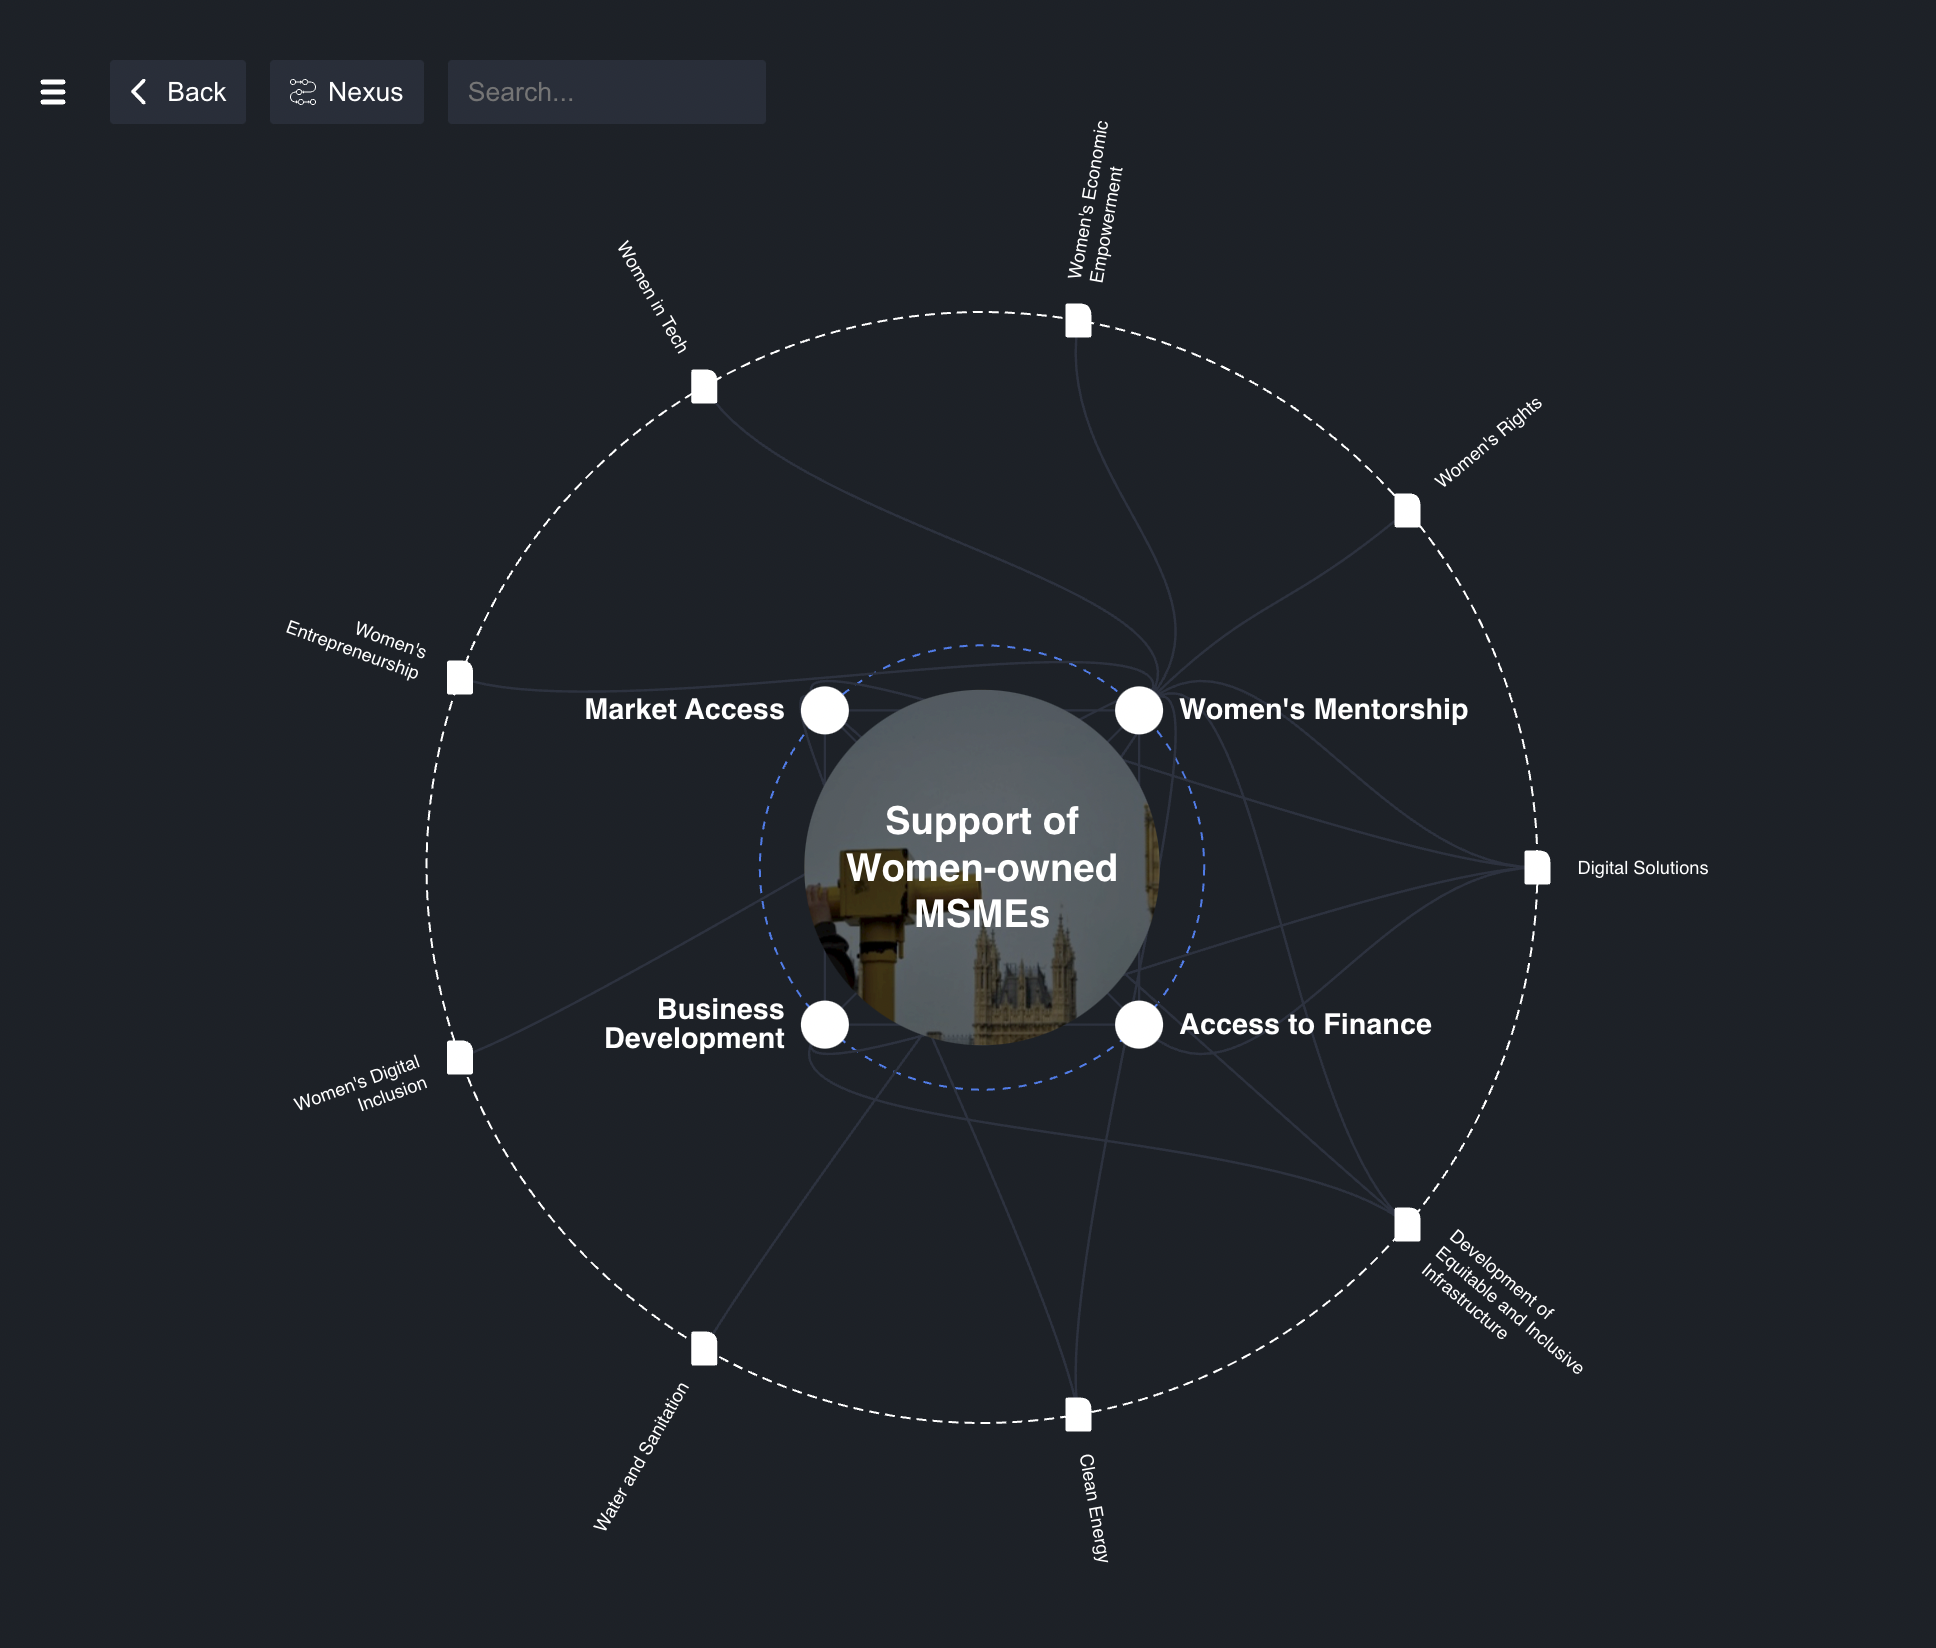
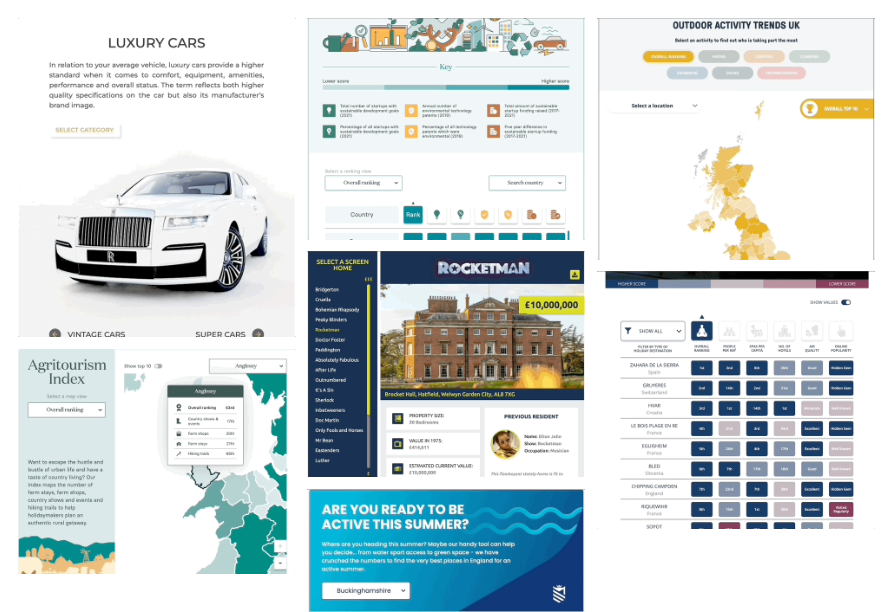
Interactive Service Delivery Visualization
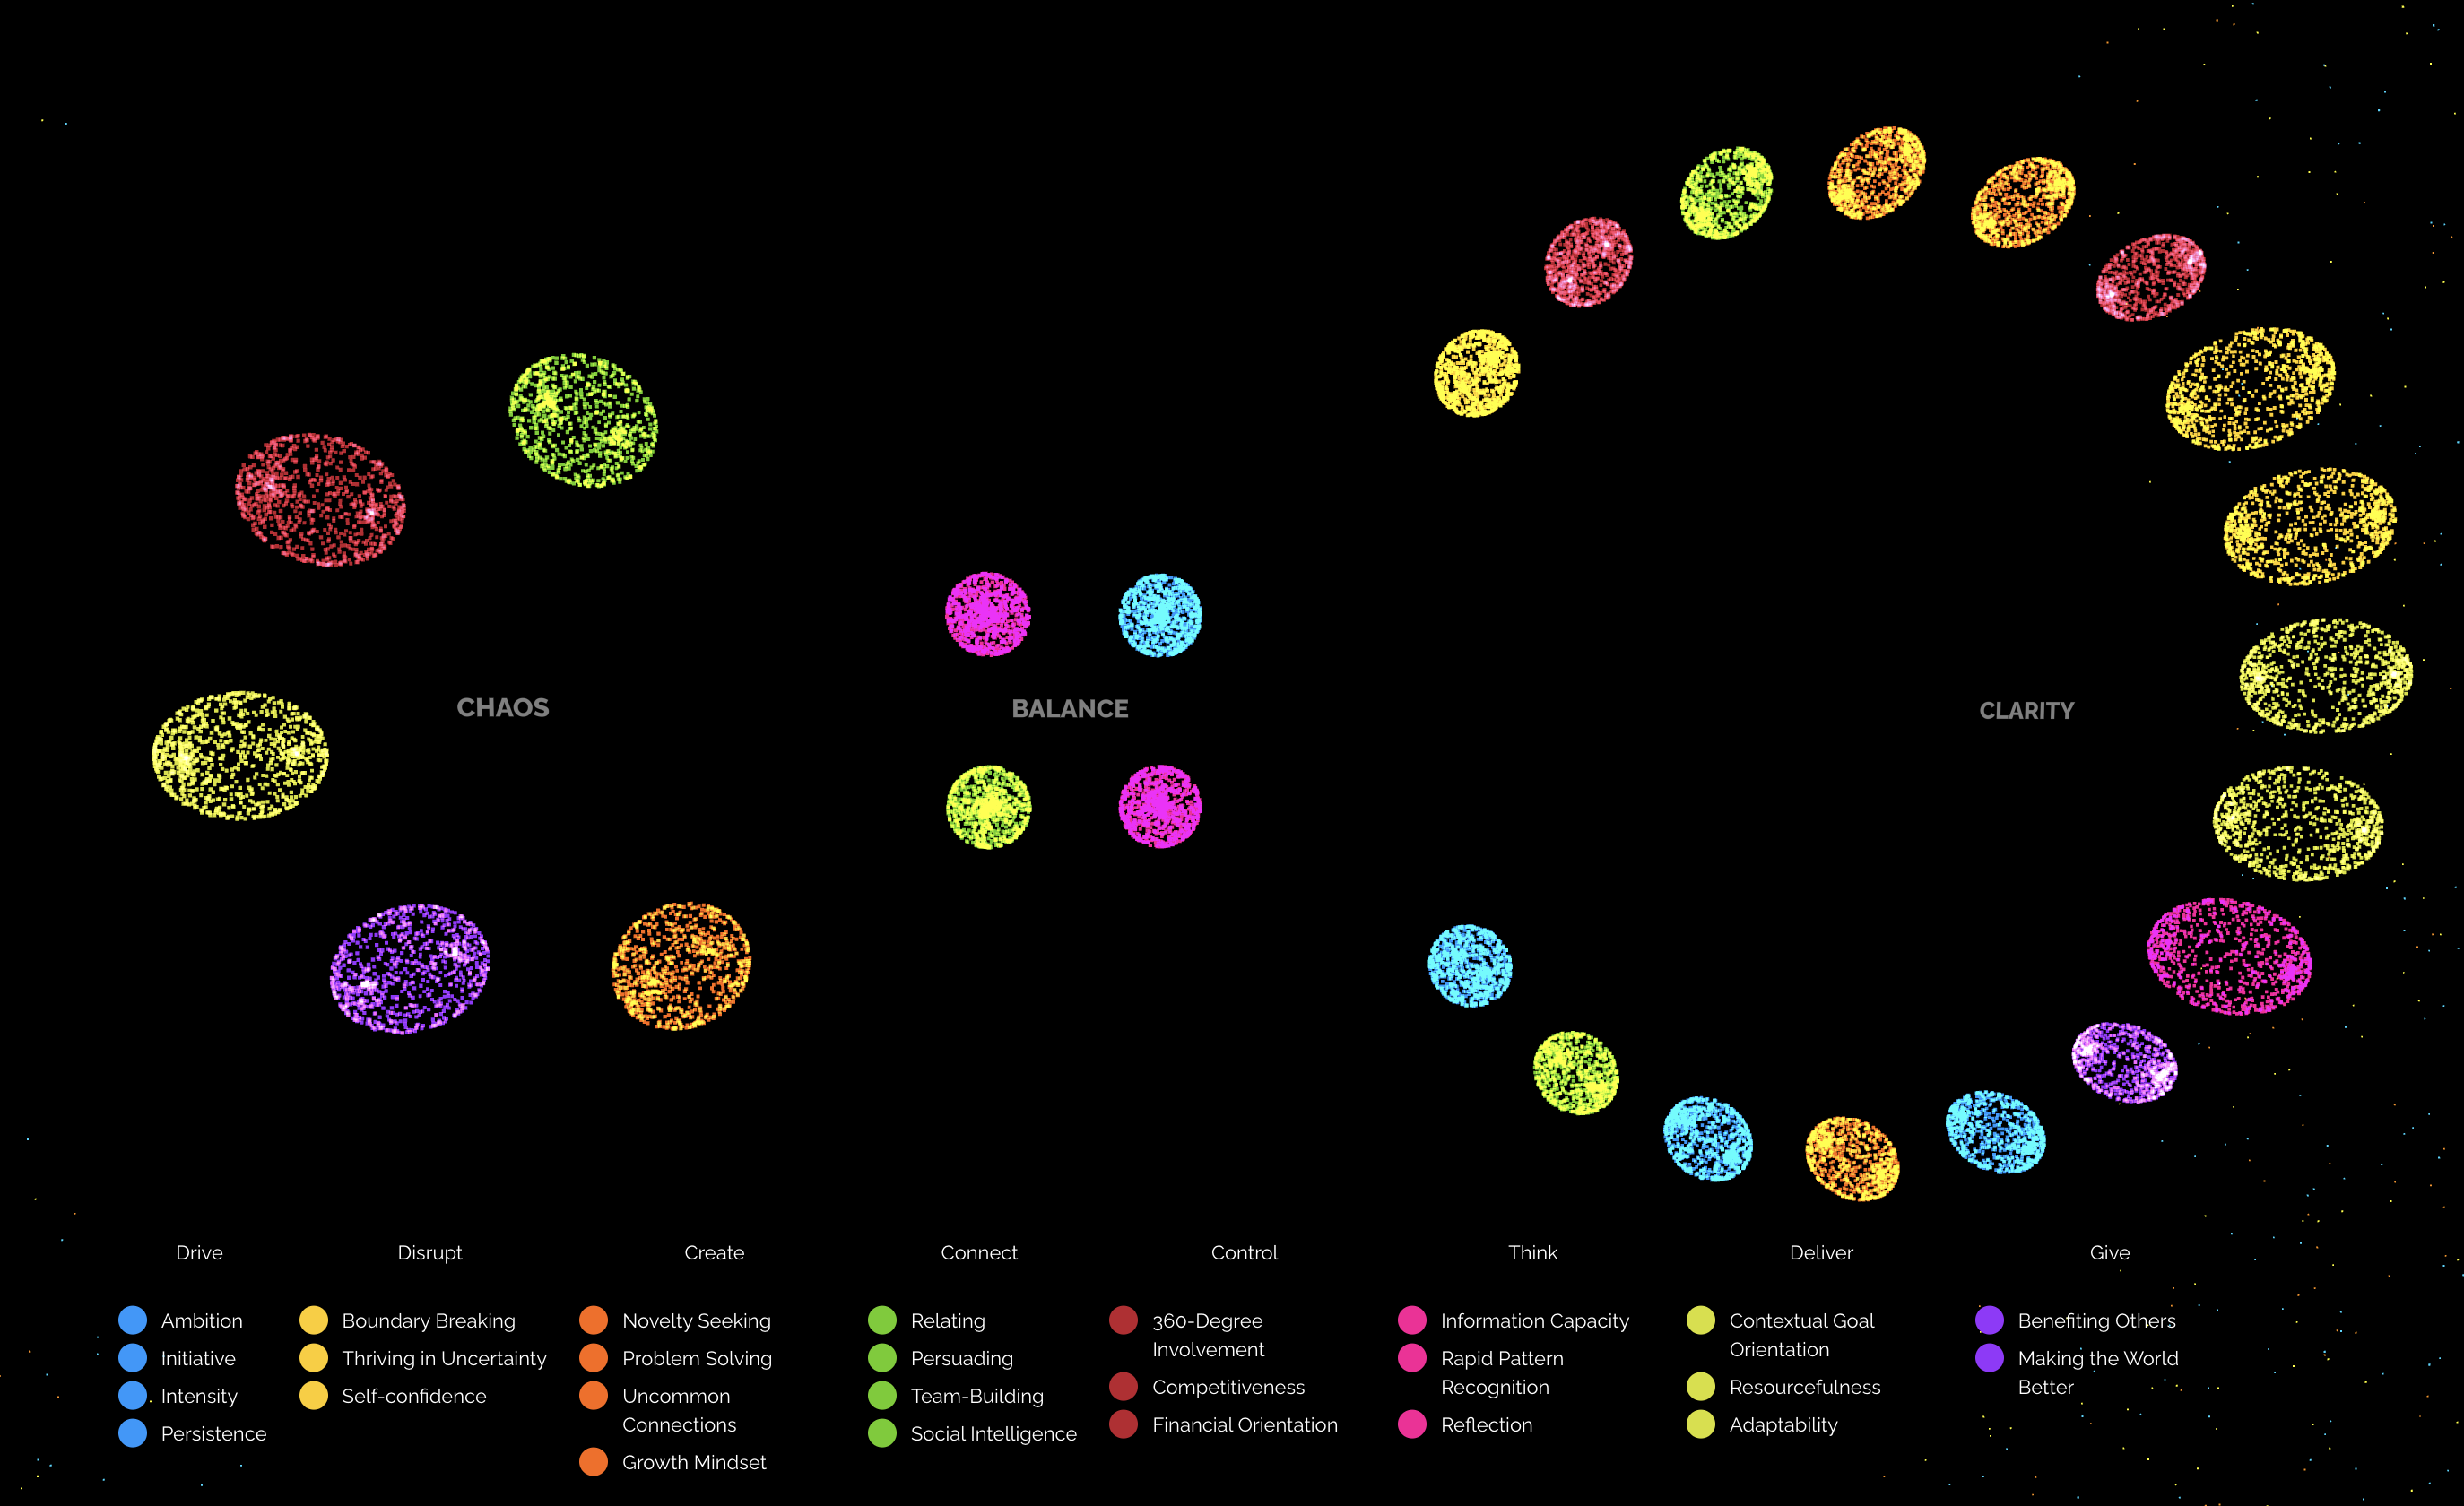
From Chaos to Clarity: A Journey in Skill Visualization
Thorus animation for website
Narrative Intelligence and Threat Detection Platform
Vault Hill
Visualization of customer journey on eshop
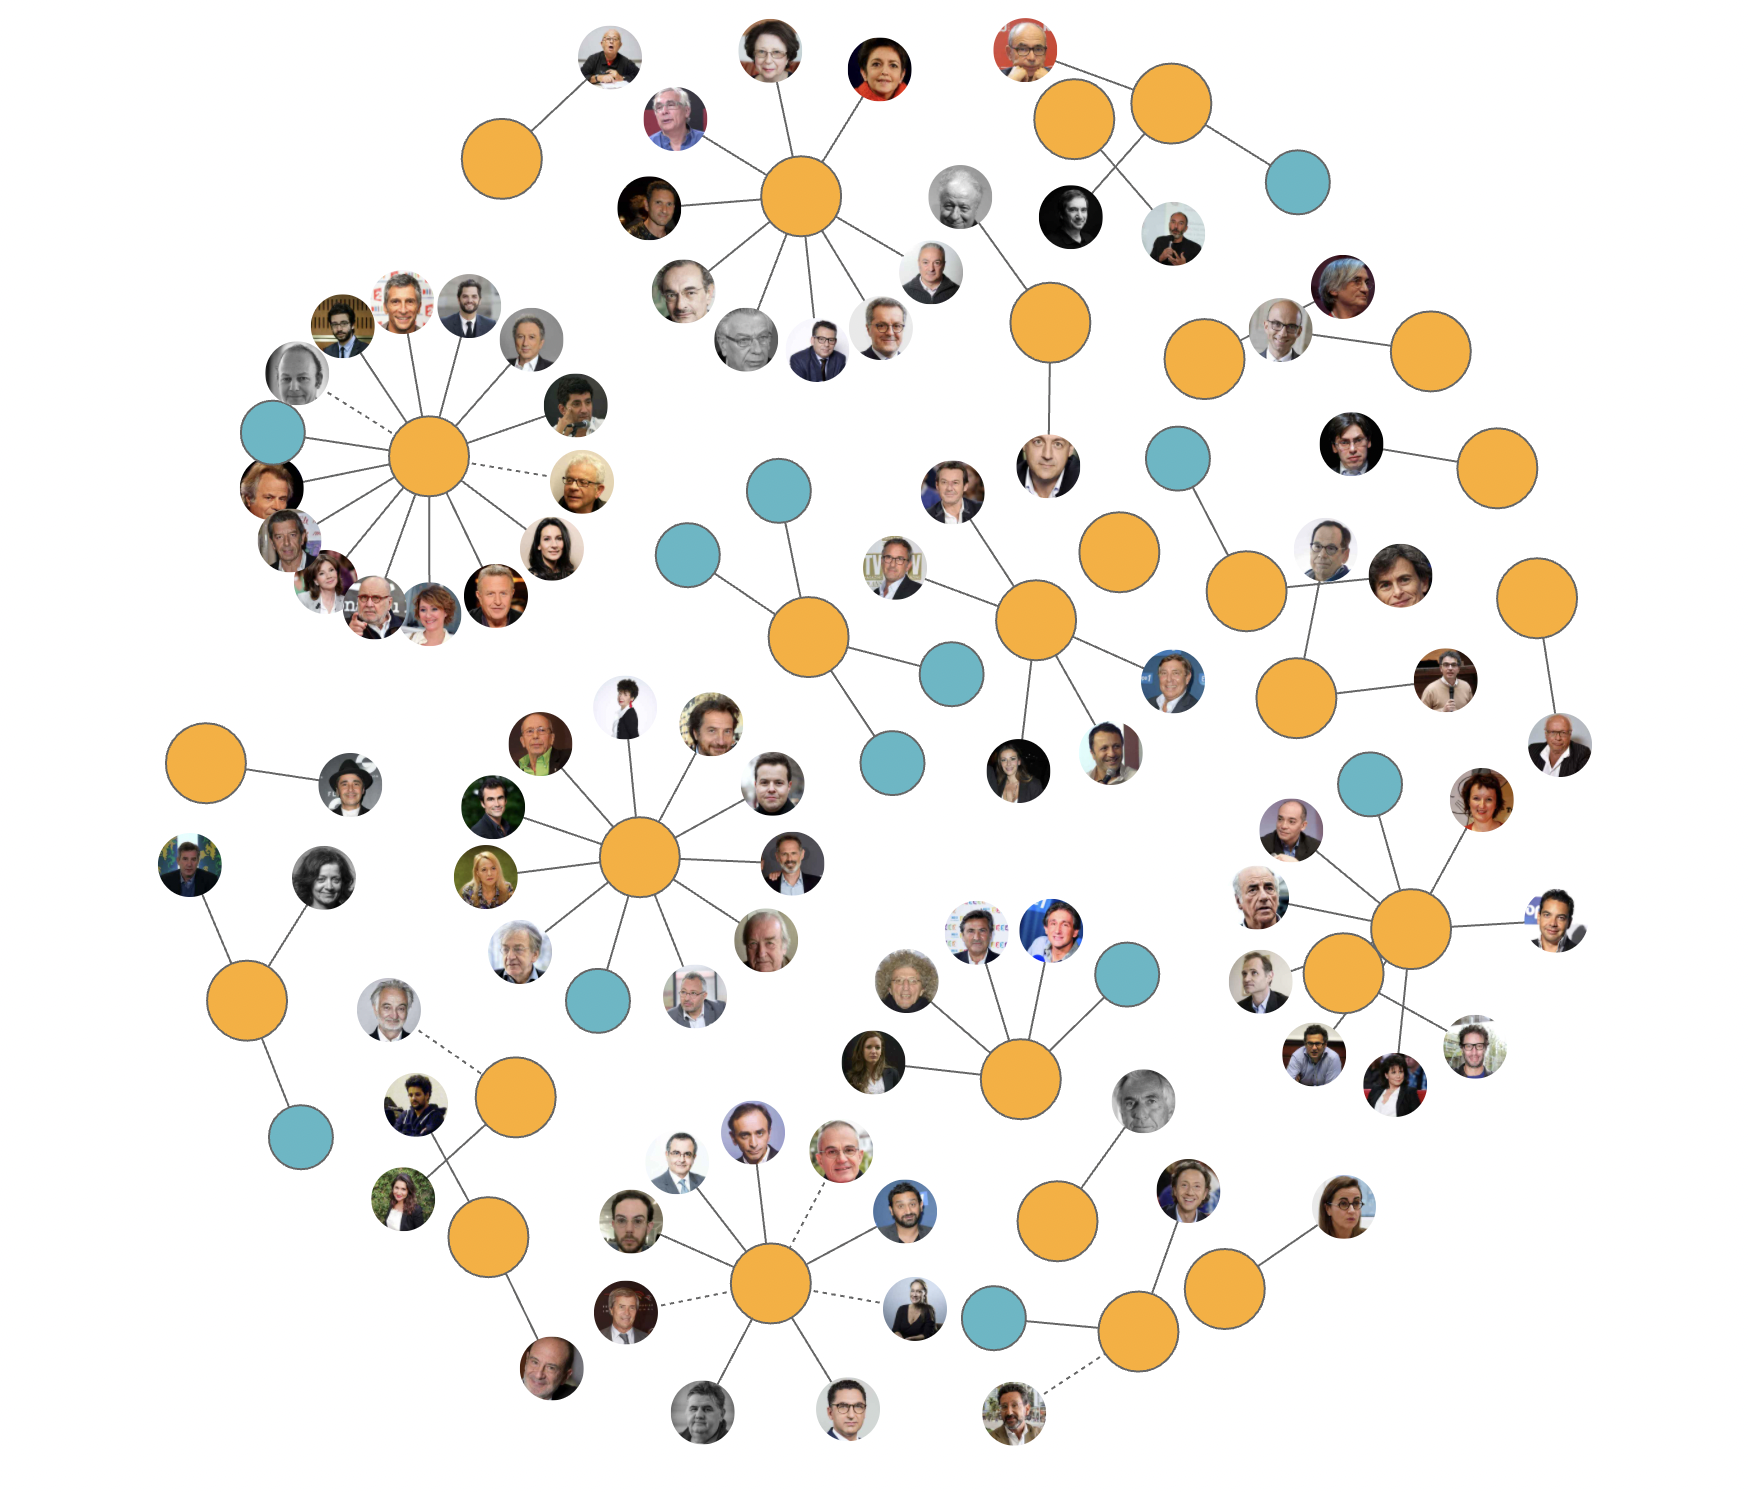
Network graphs using D3 force
Radial Org Chart
Visualization of Machine Learning Models
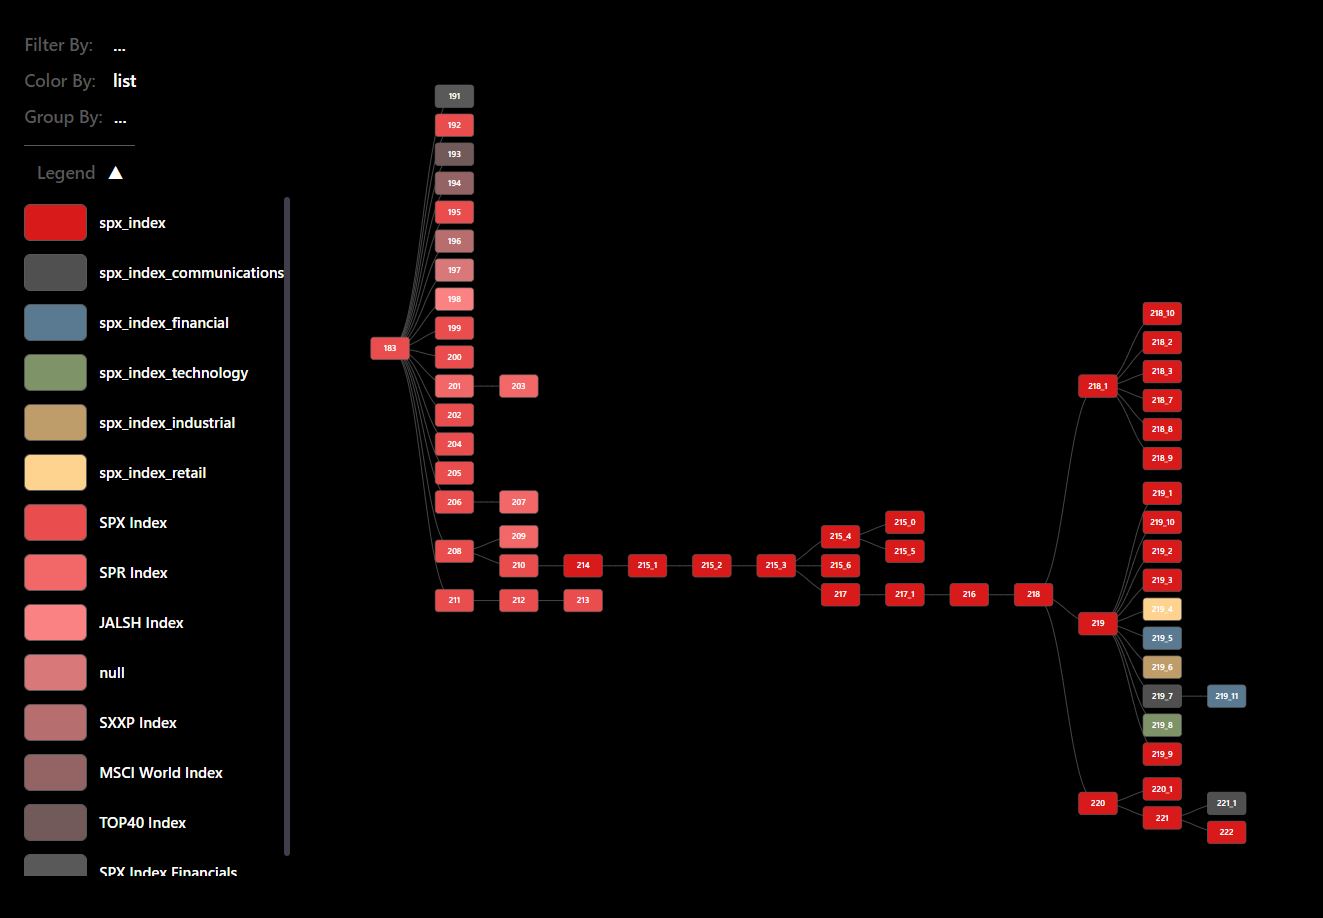
Radial Clustered Tree and Chord Charts for Hierarchical Data Visualization
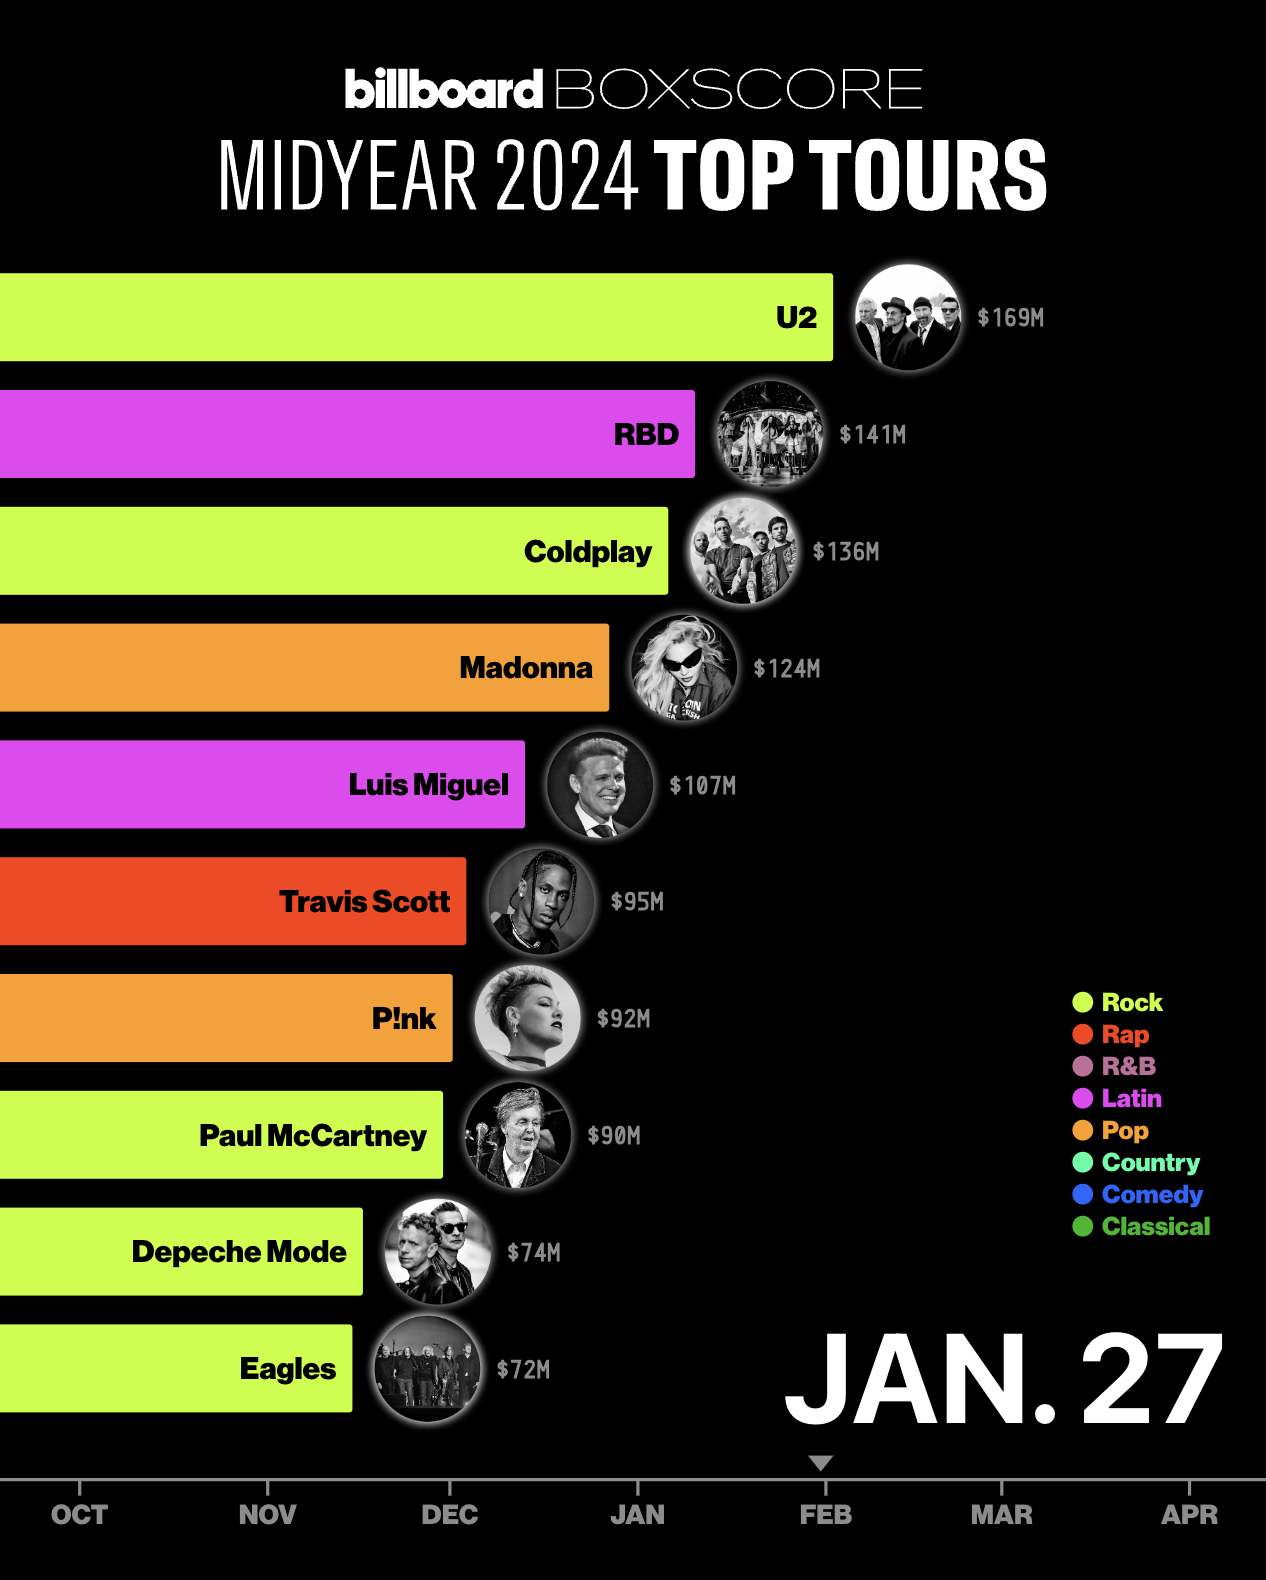
An interactive bar chart race animation tracking Billboard Boxscore’s Midyear Top Tours from October 2023 to March 2024.
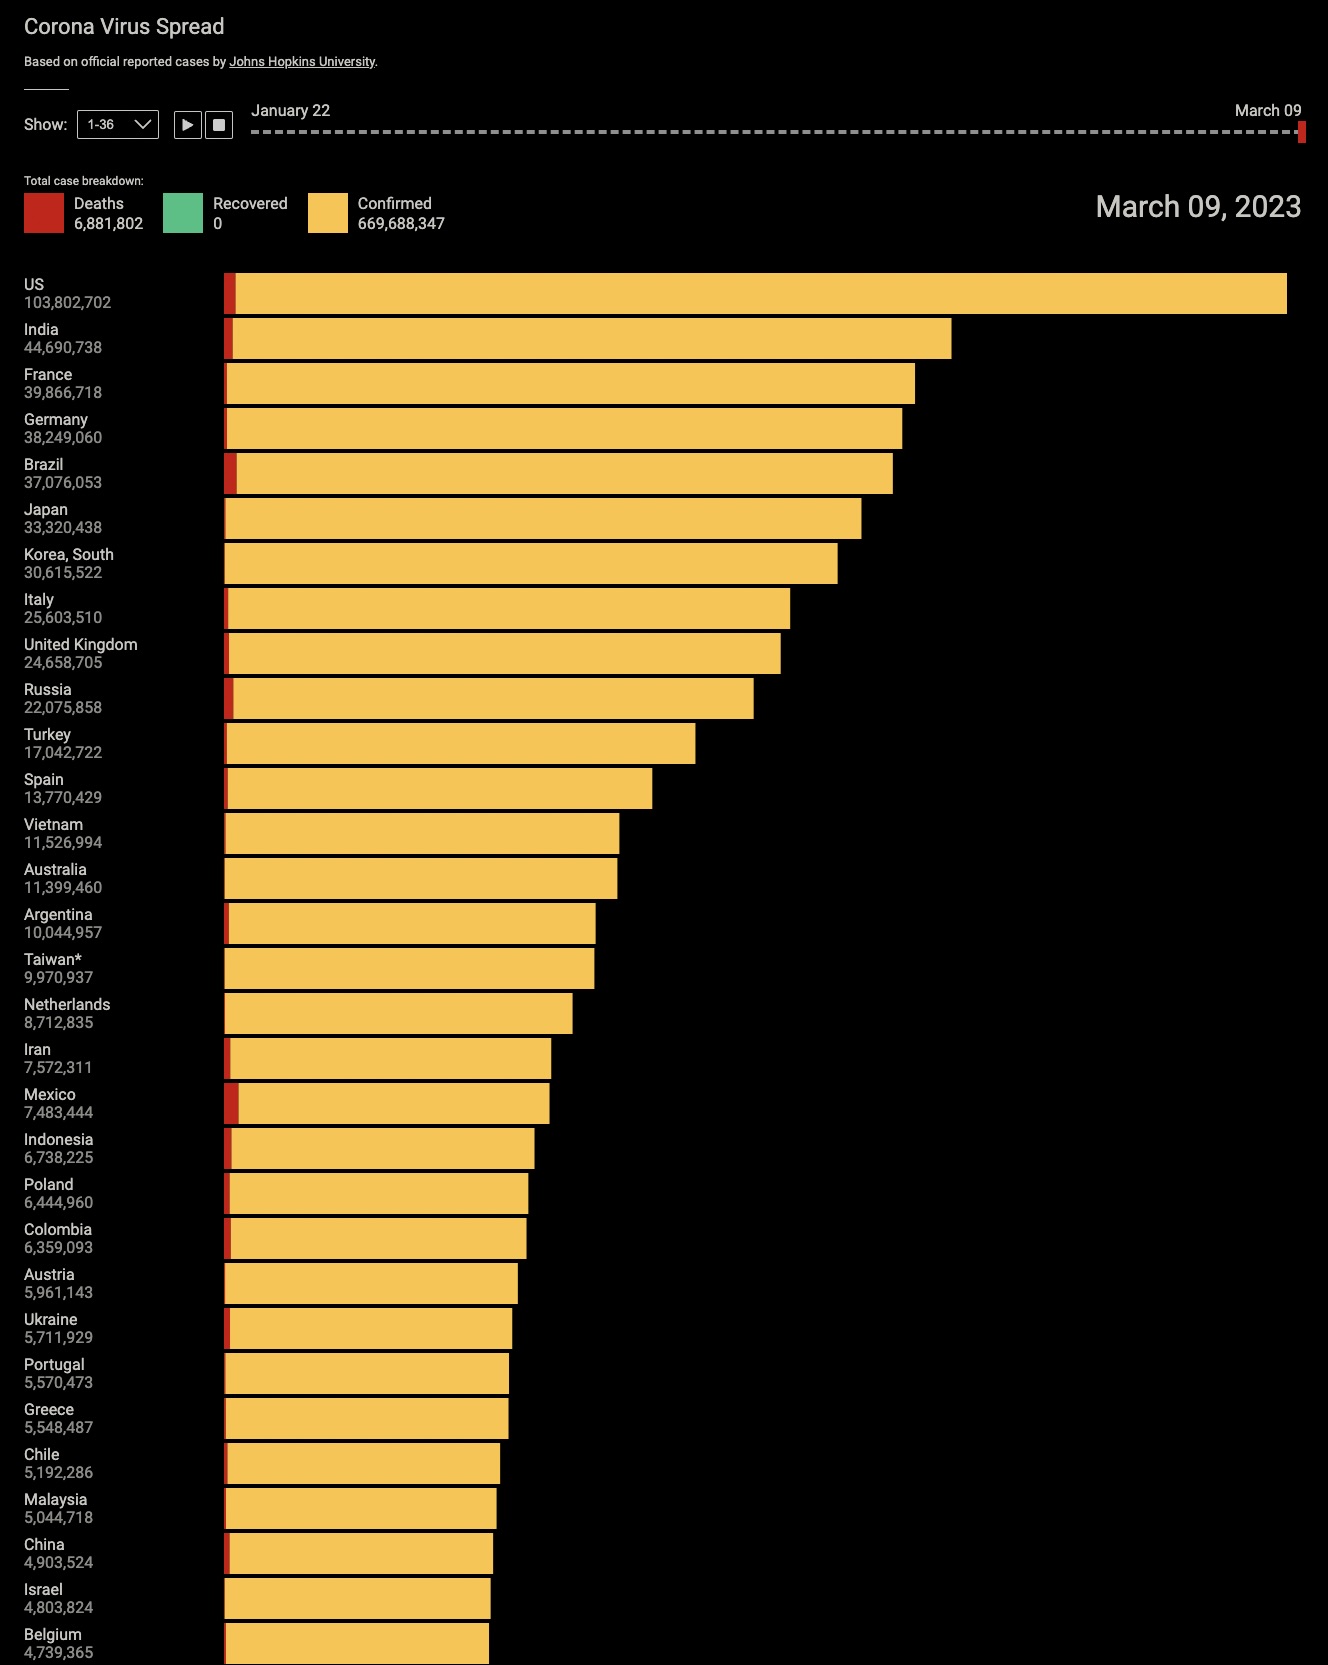
Covid-19 spread across countries
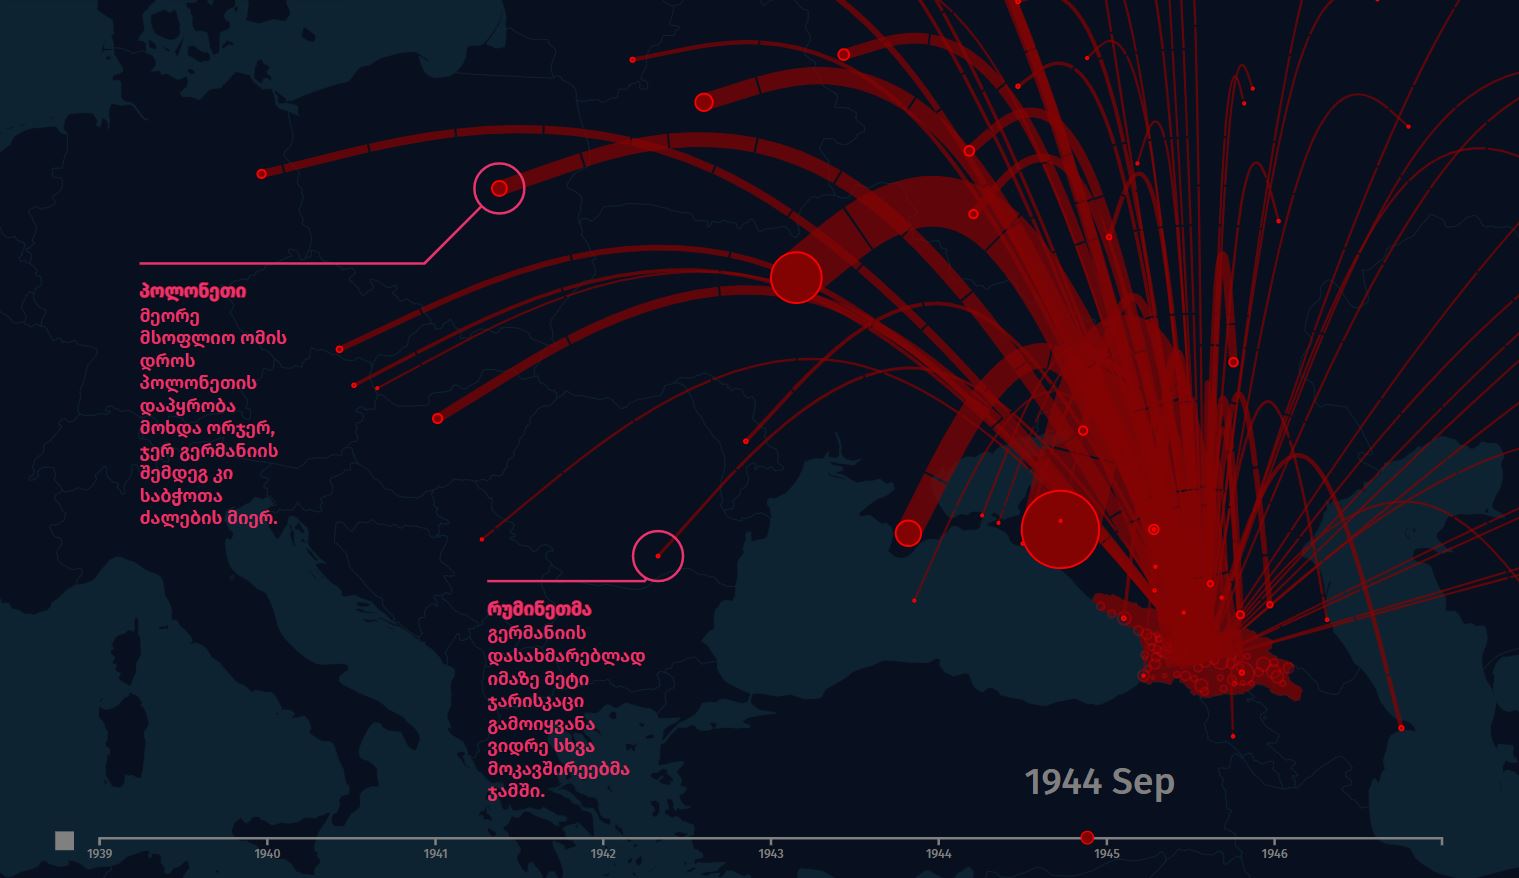
How 300000 Georgians died in World War 2
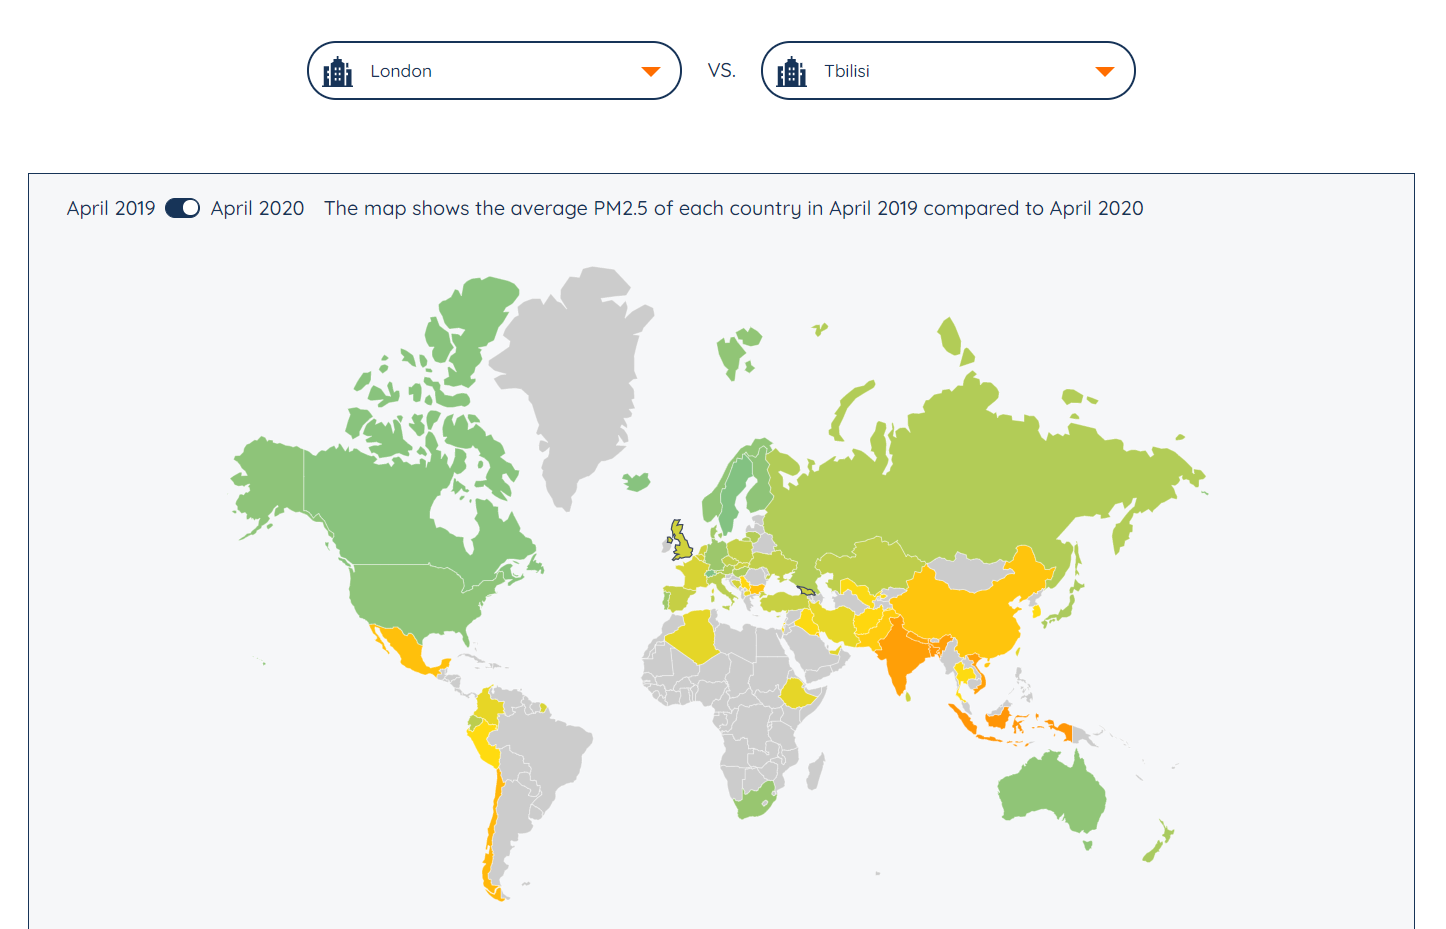
Air polution level before and during lockdown
Interactive Events Calendar
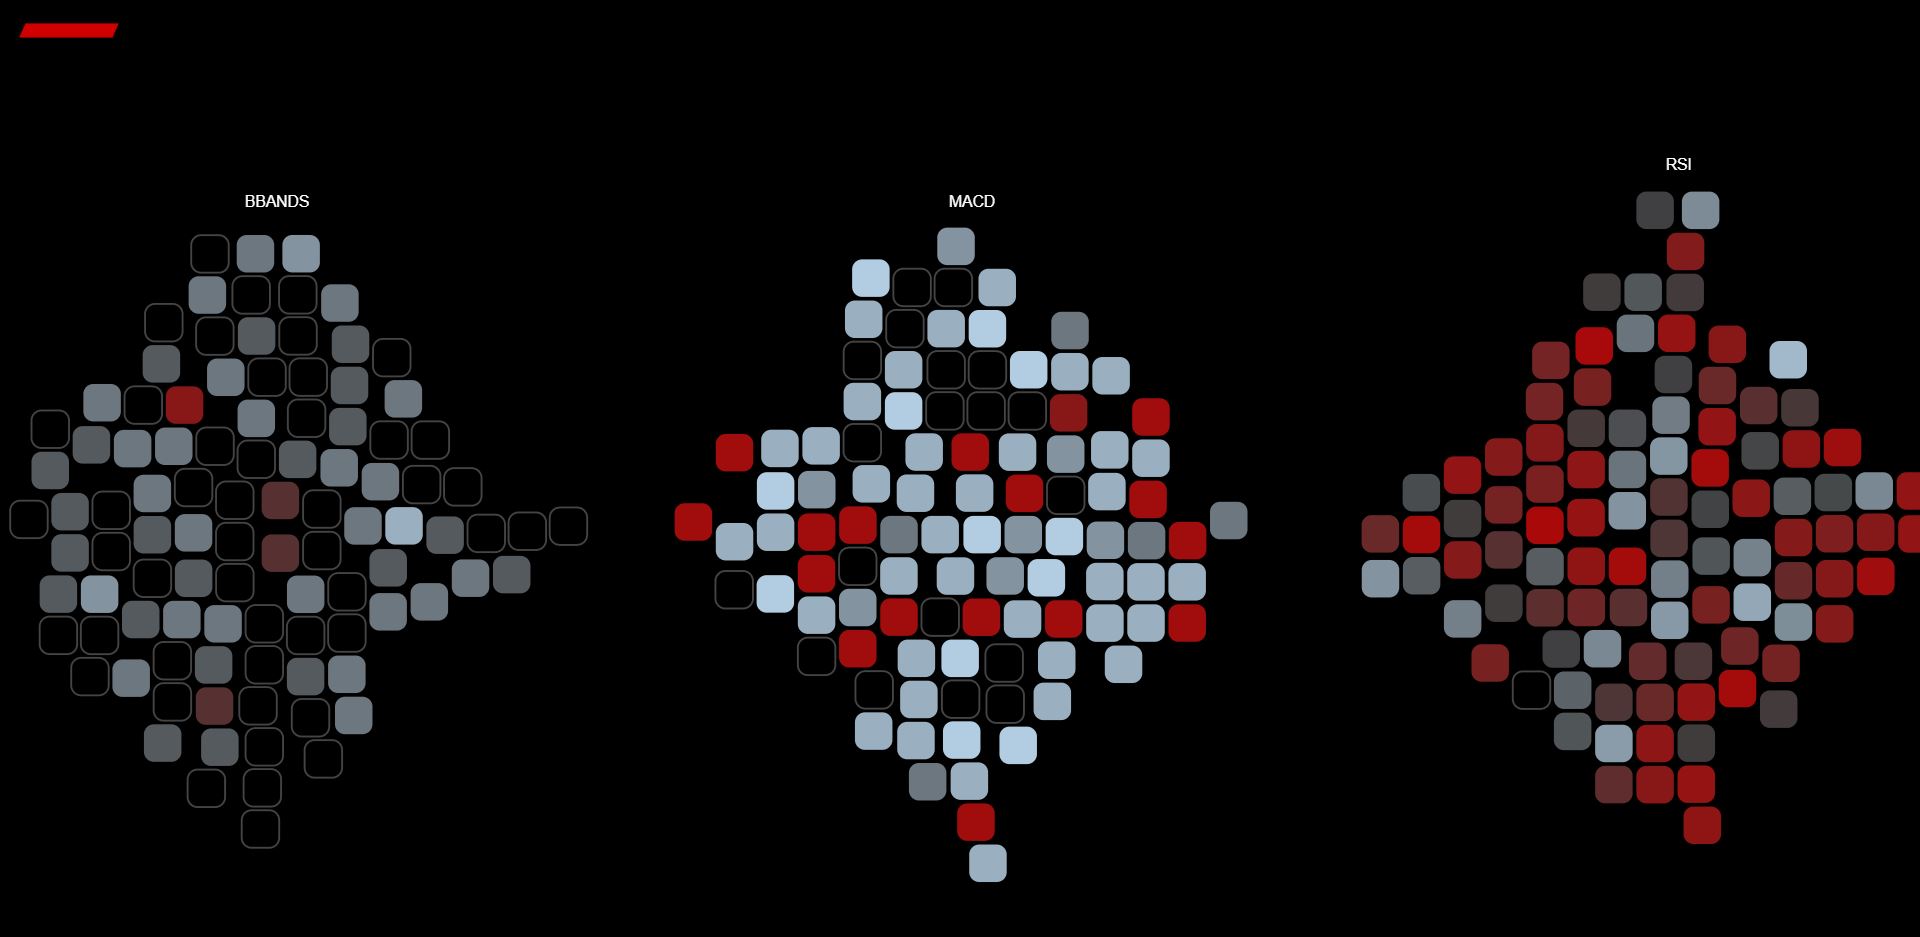
Signal Strength Visualization Tool
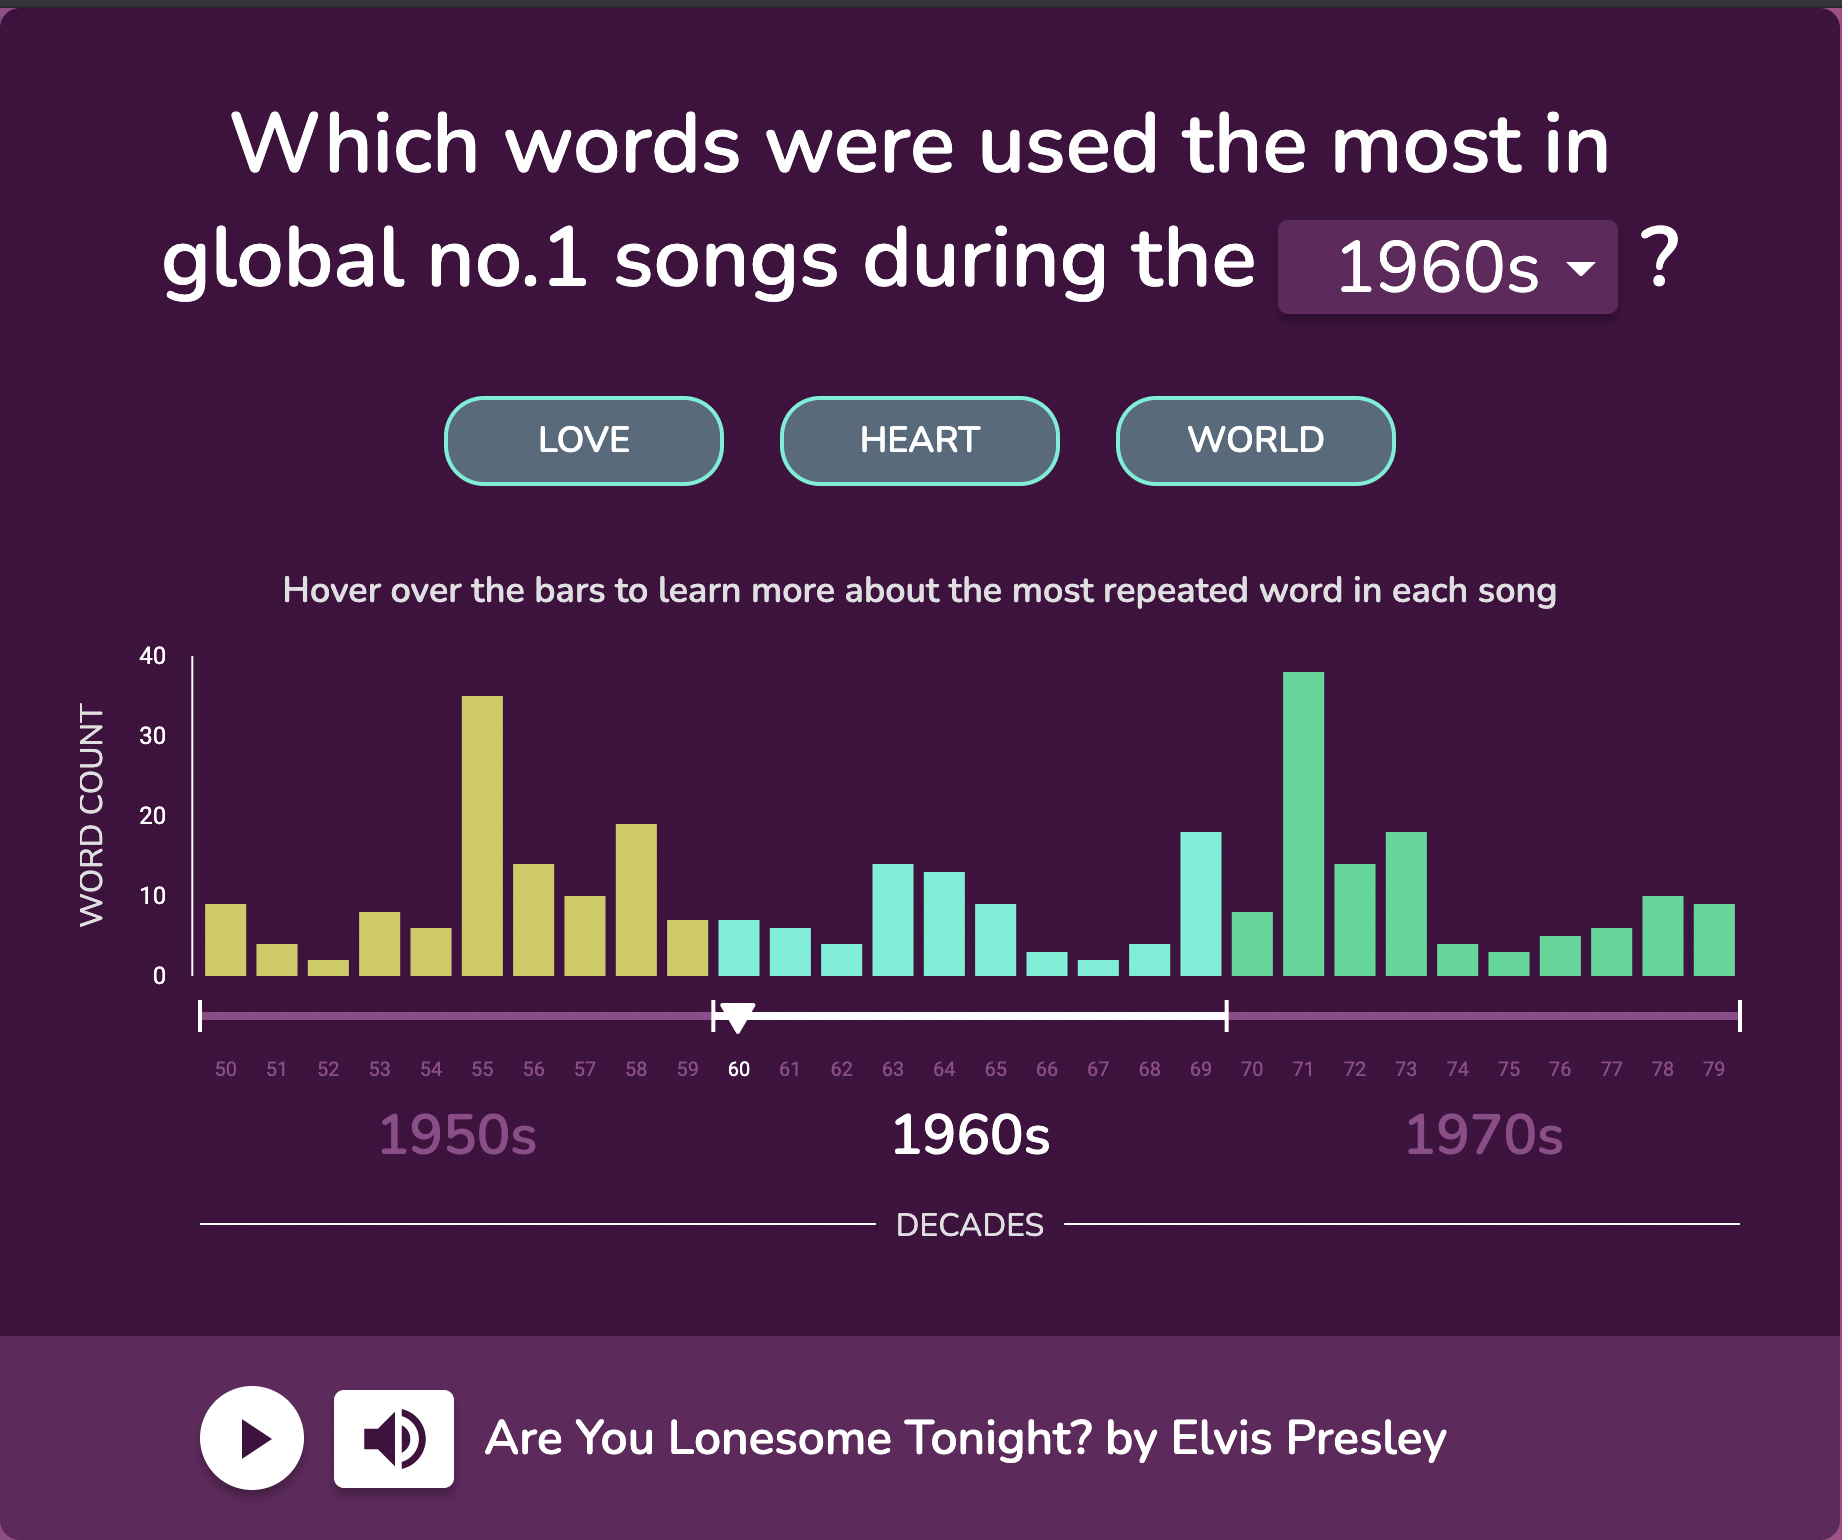
Century of Hits – A Bar Chart Visualization Tool
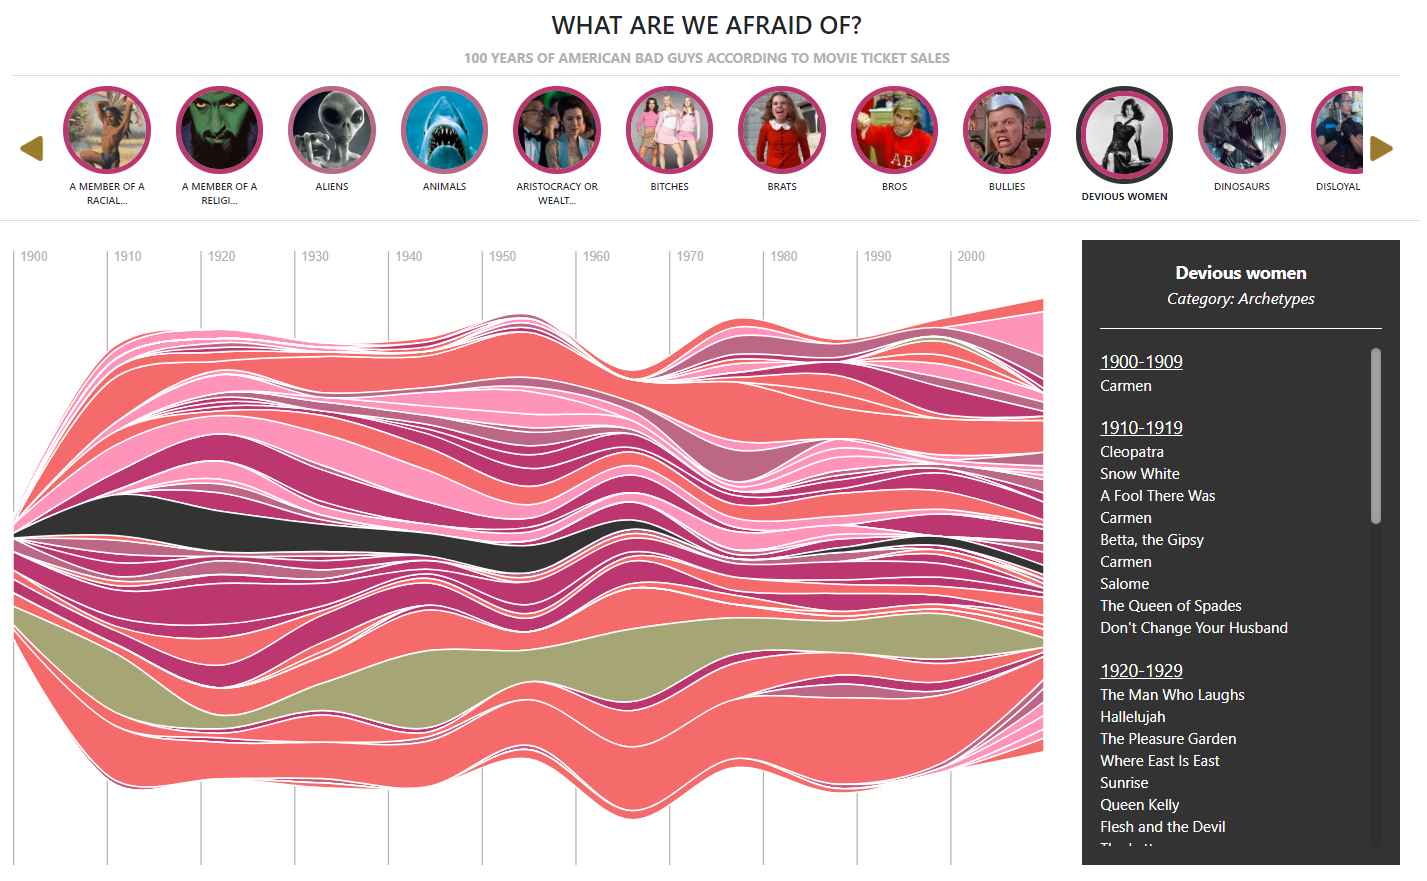
100 Years of American Bad Guys: Movie Ticket Sales Analysis
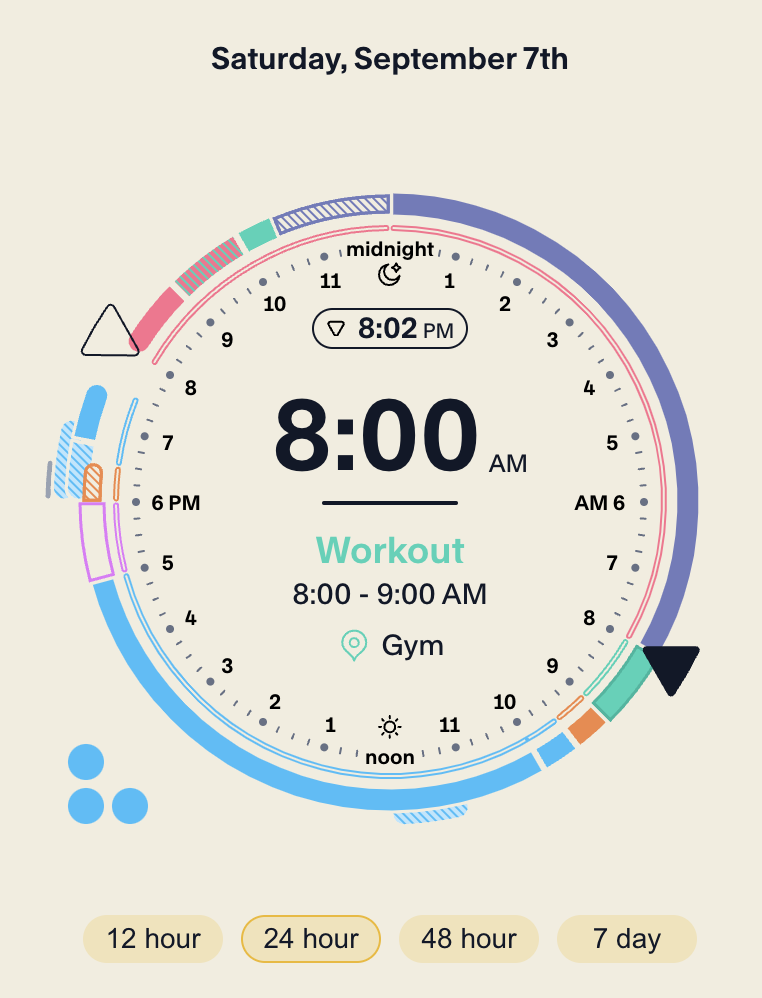
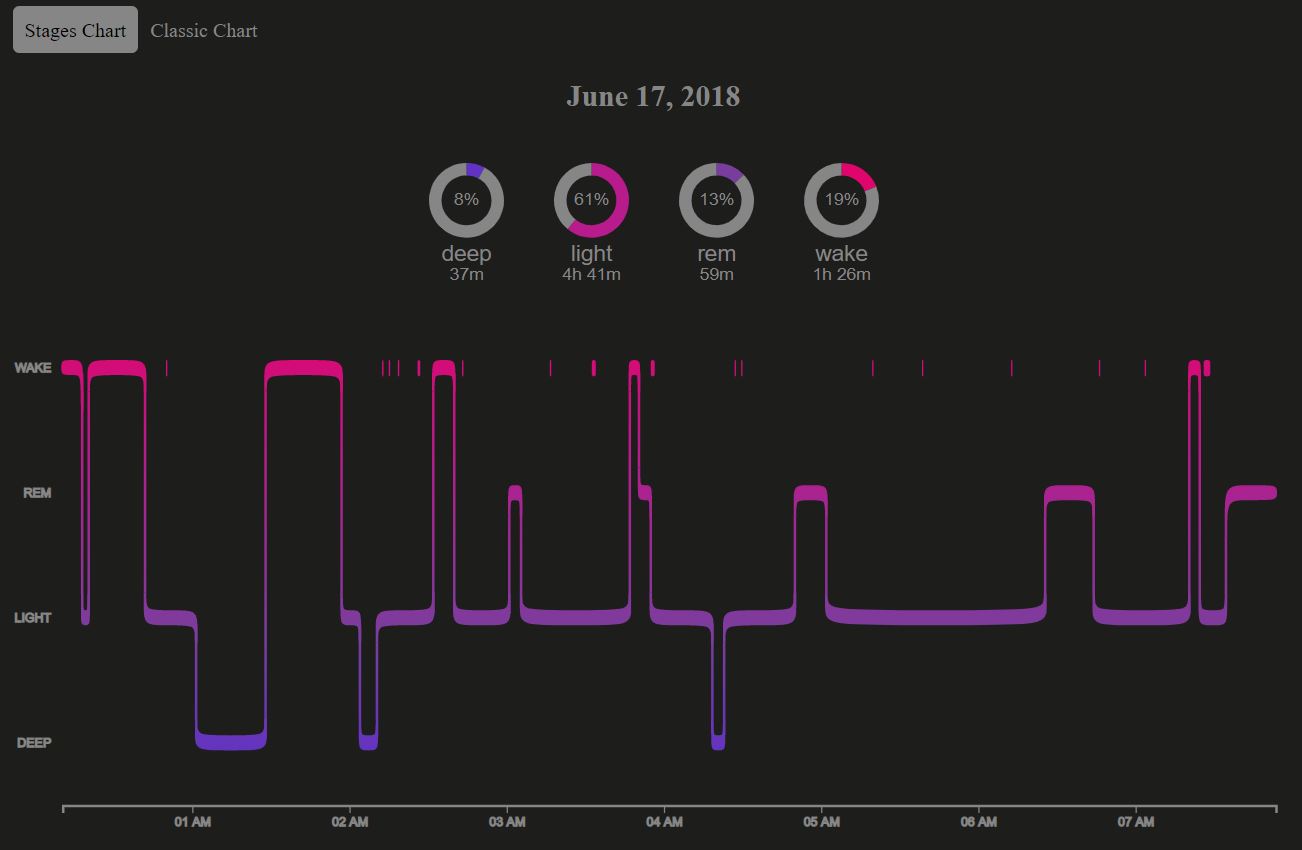
Visualization of sleep cycle
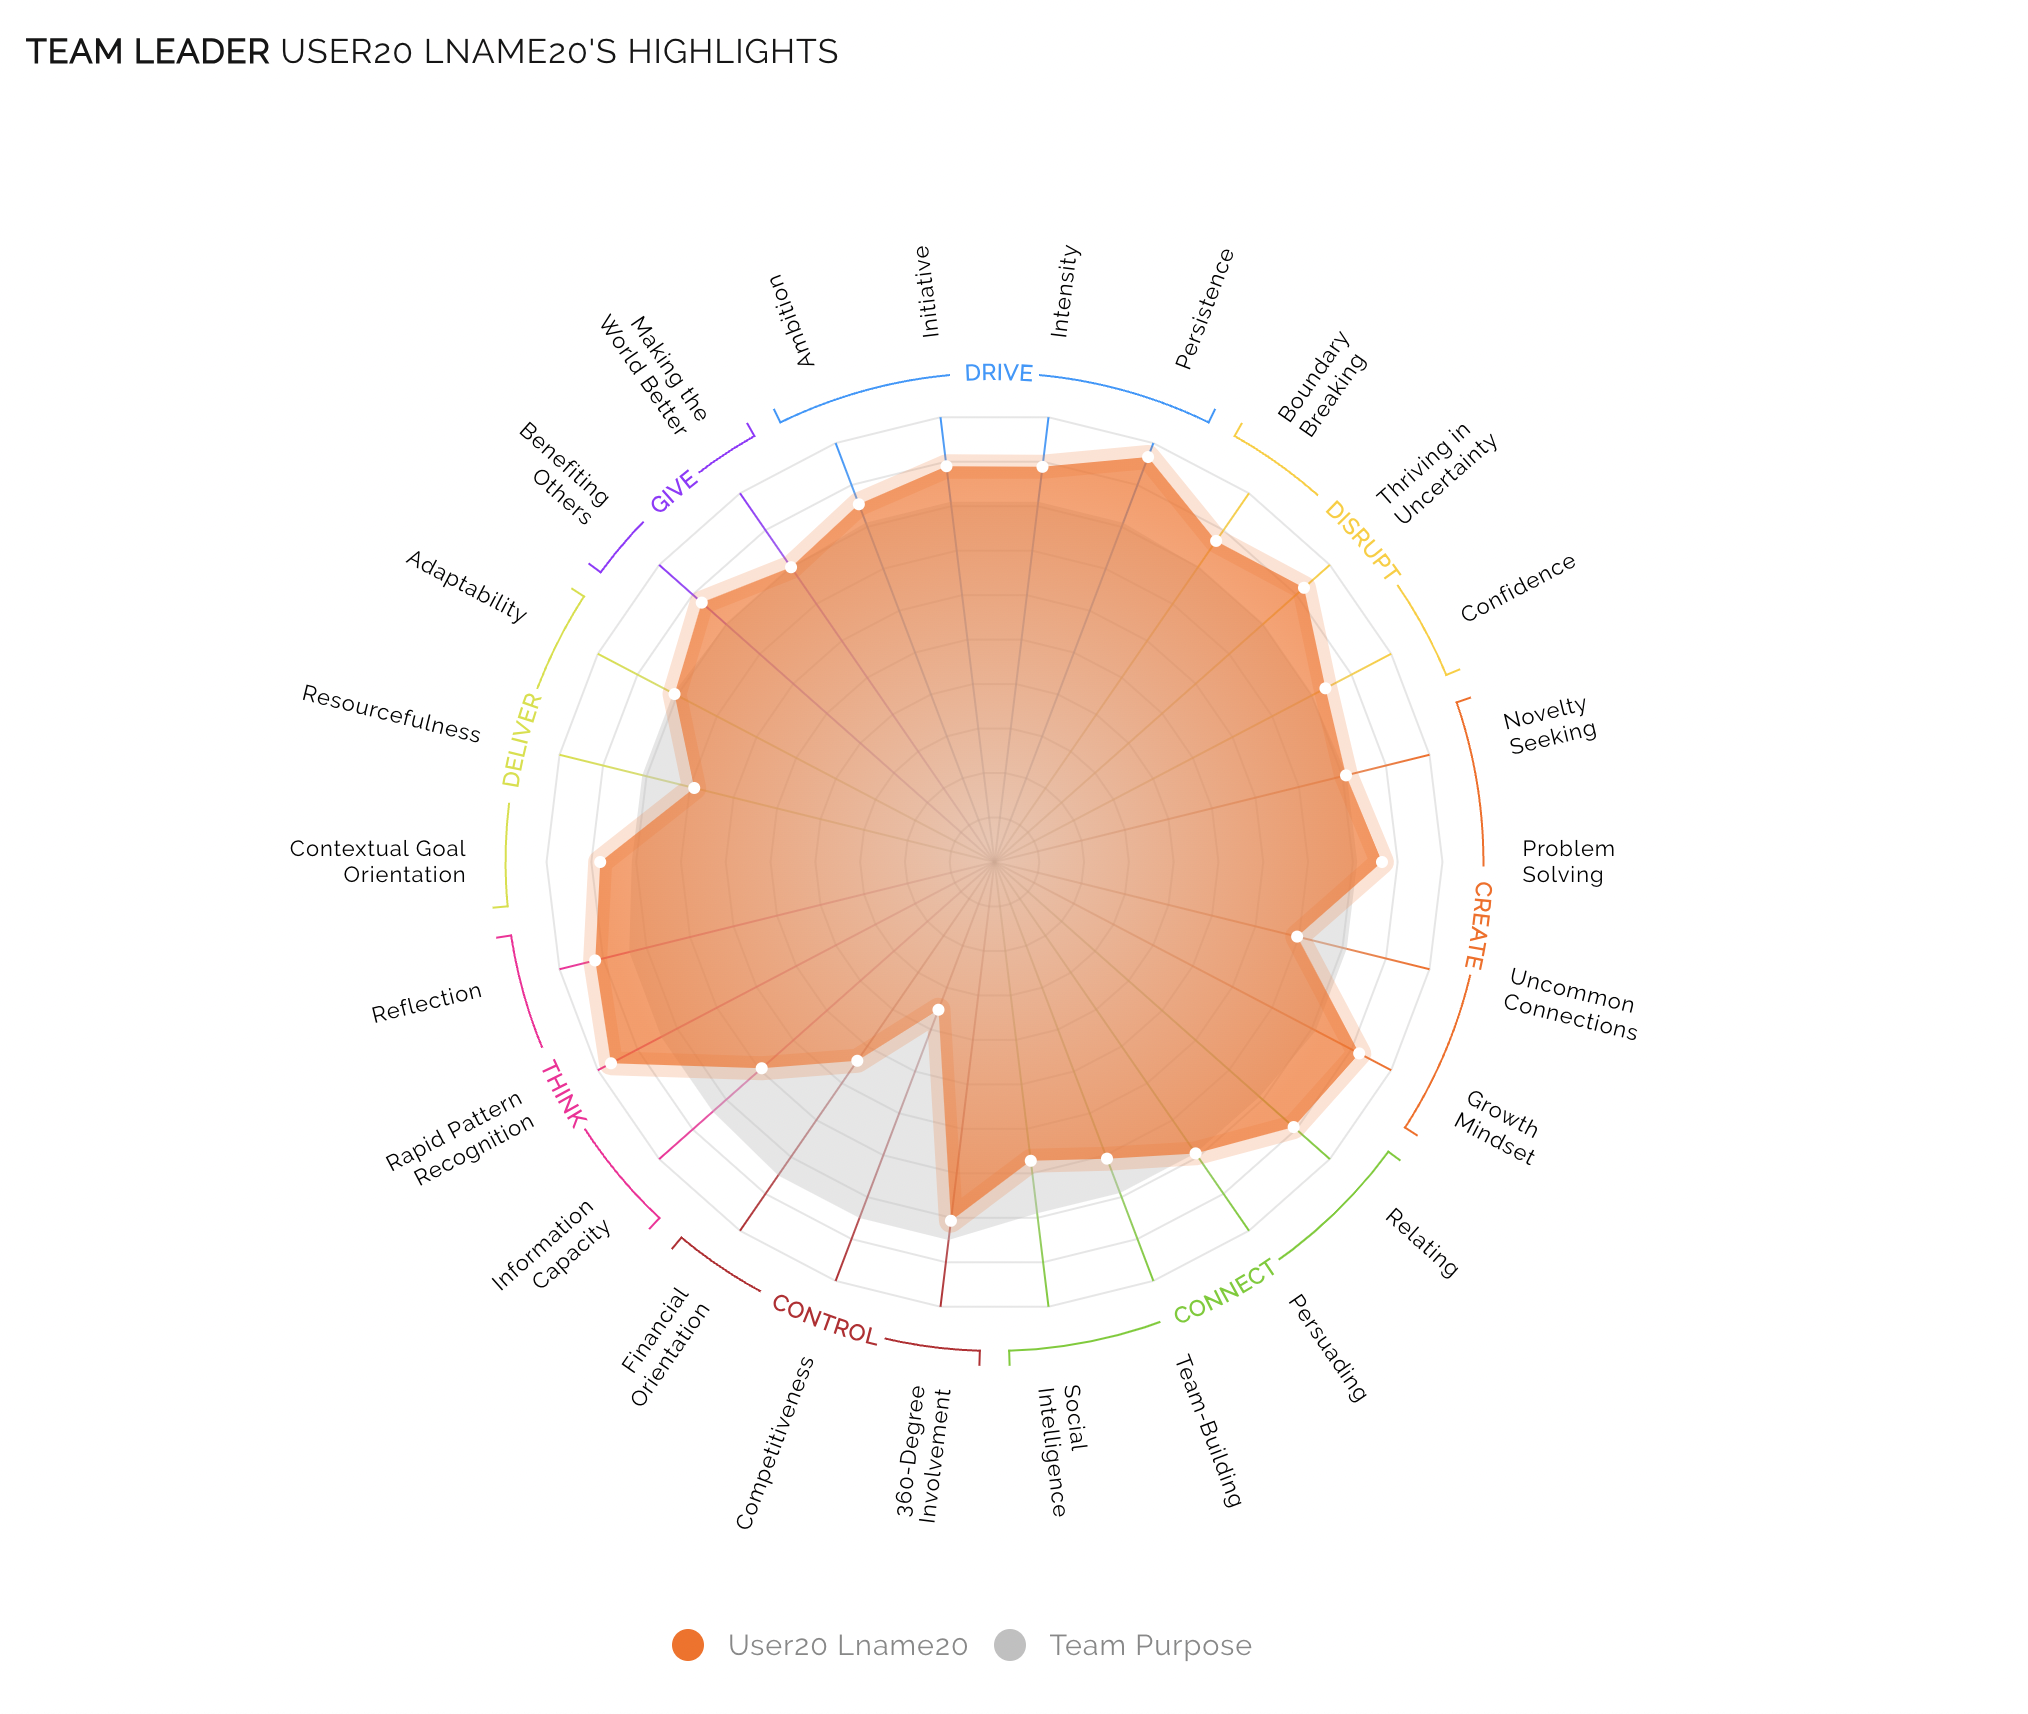
Built different for team analysis platform
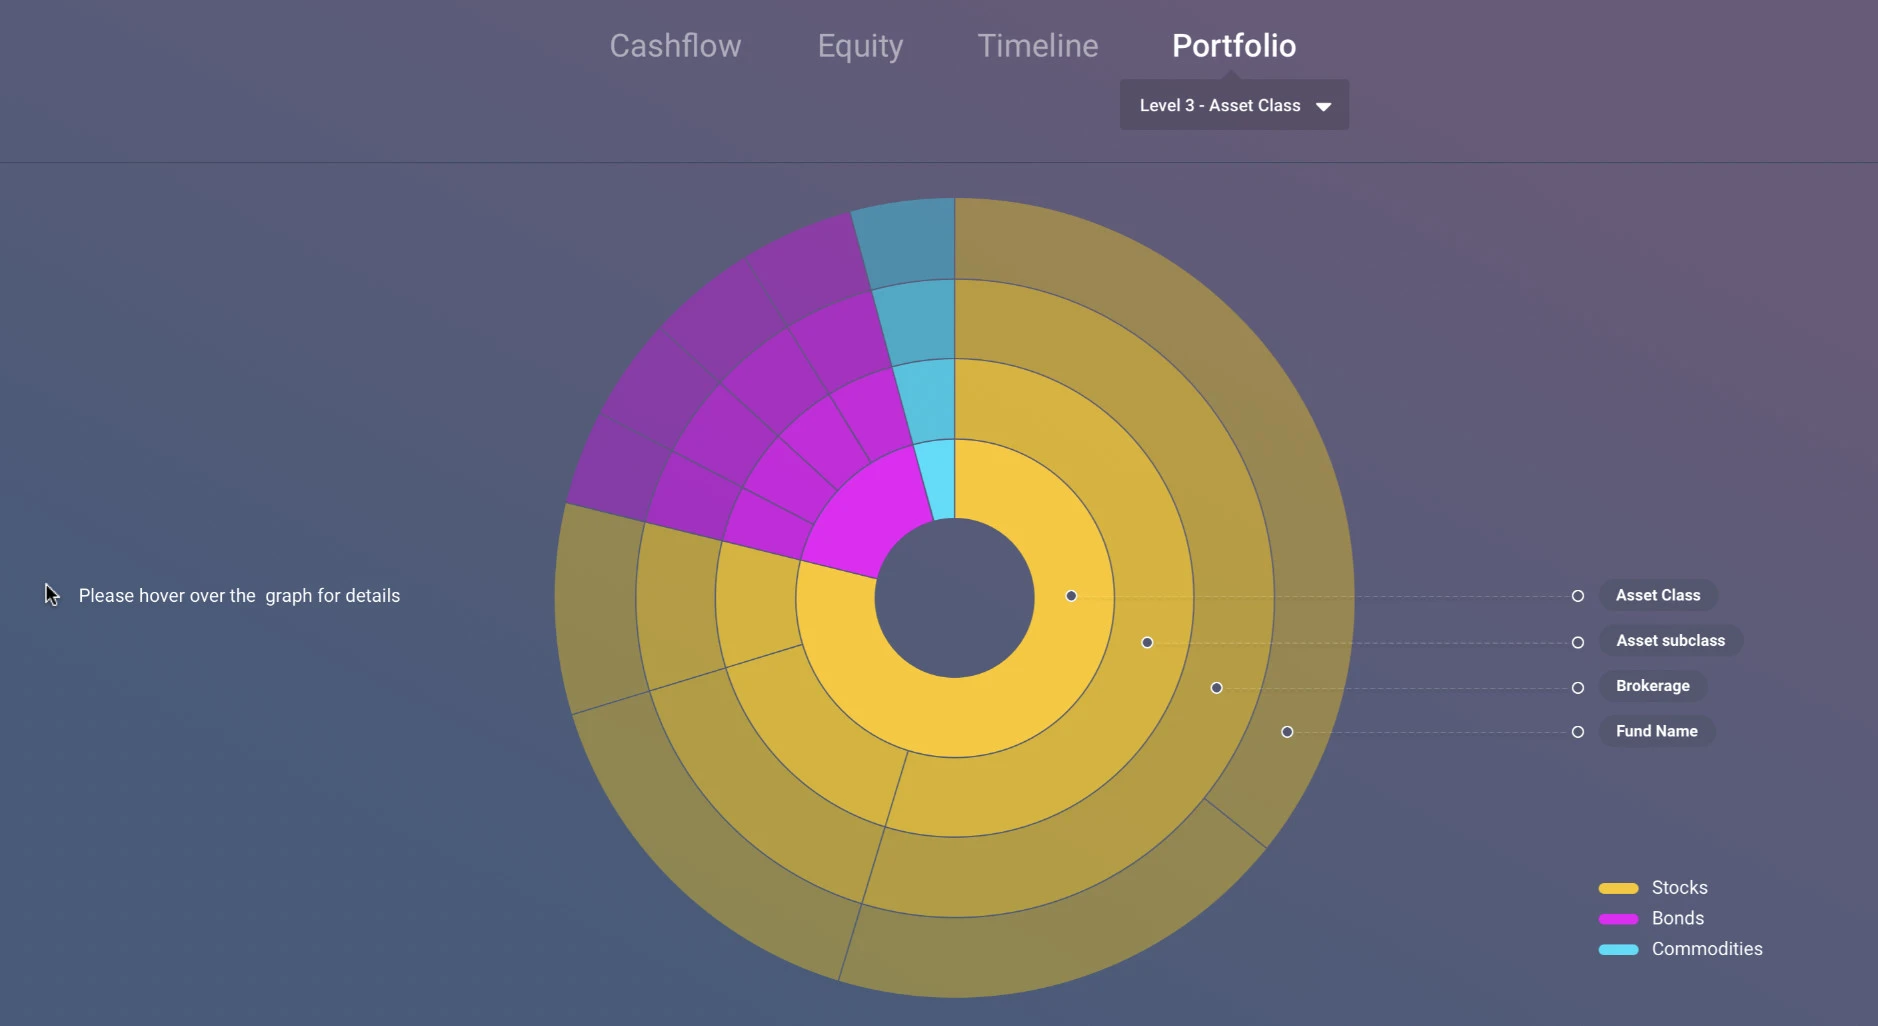
Collection of financial charts
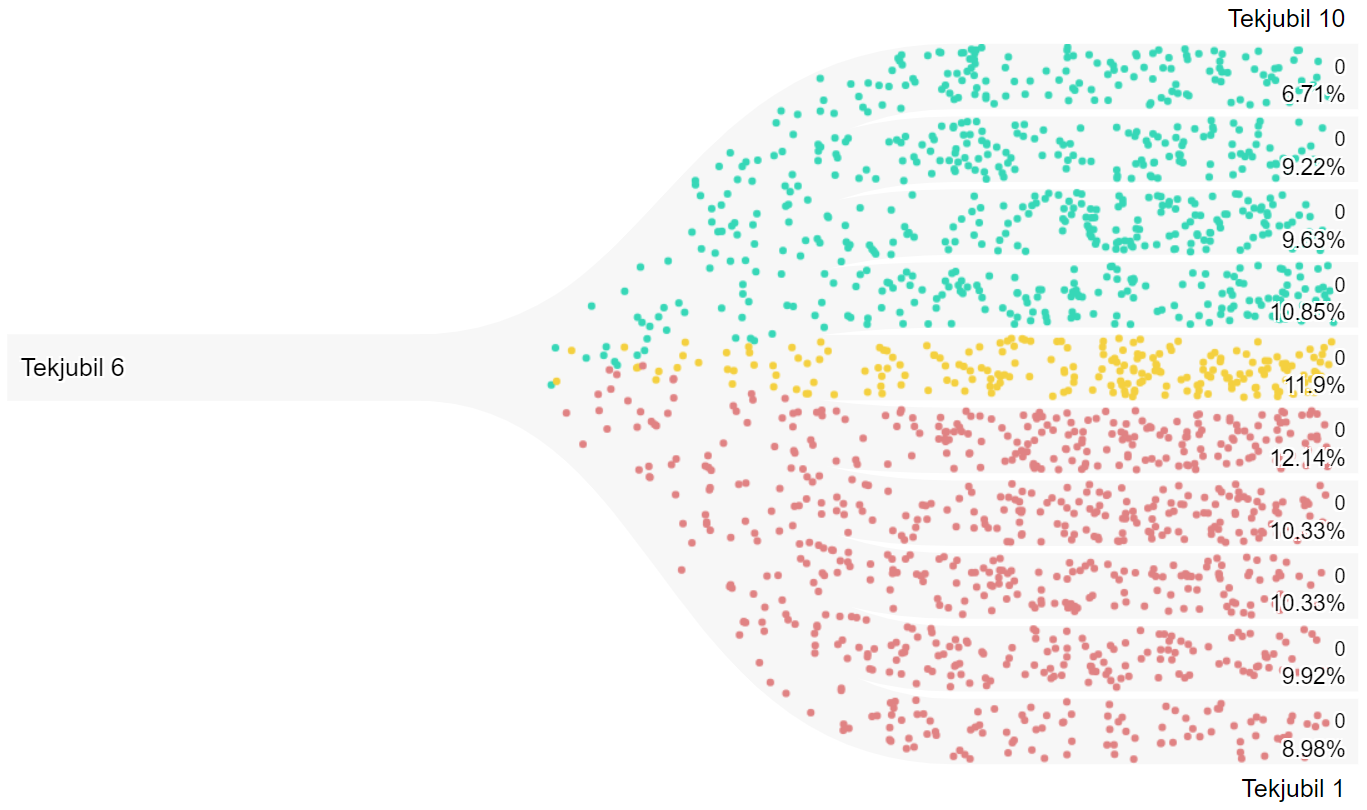
Visualizing income distribution into different groups