A Visual Race of 2024’s Biggest Concerts
An interactive bar chart race animation tracking Billboard Boxscore’s Midyear Top Tours from October 2023 to March 2024.
Overview
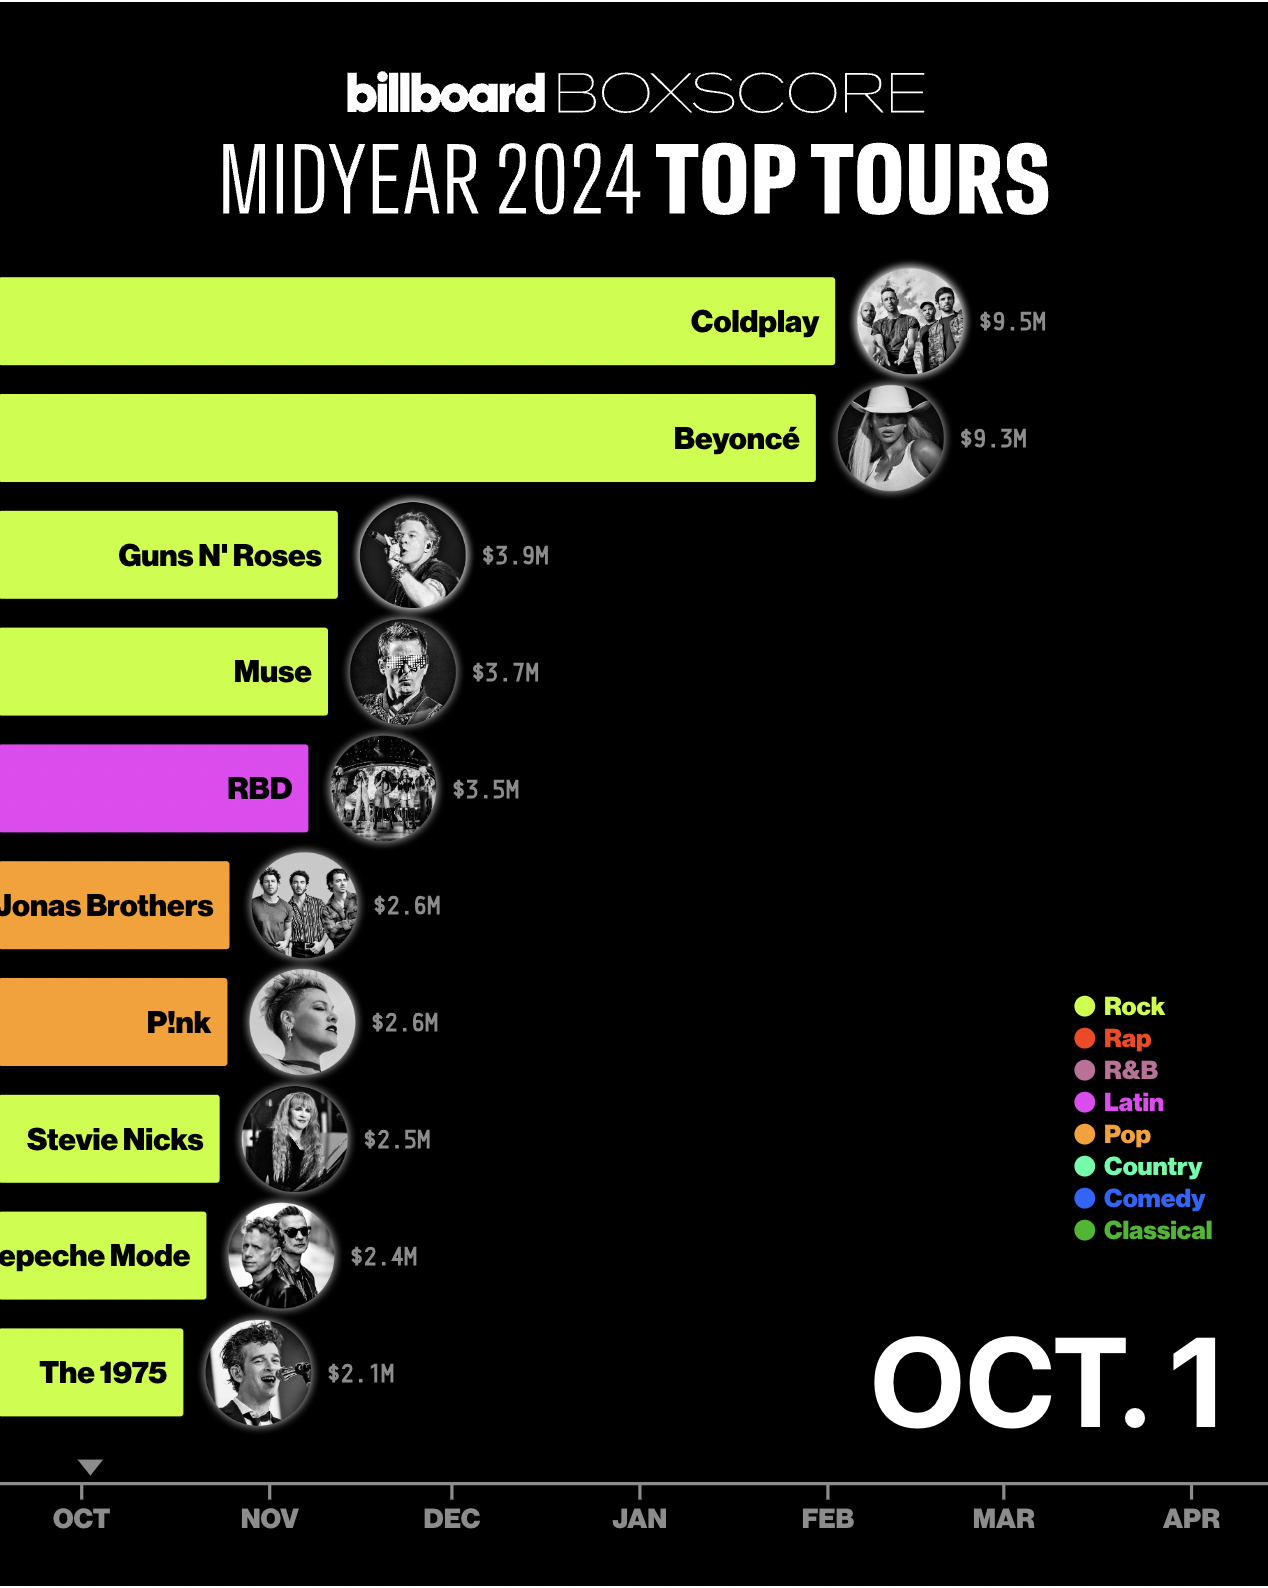
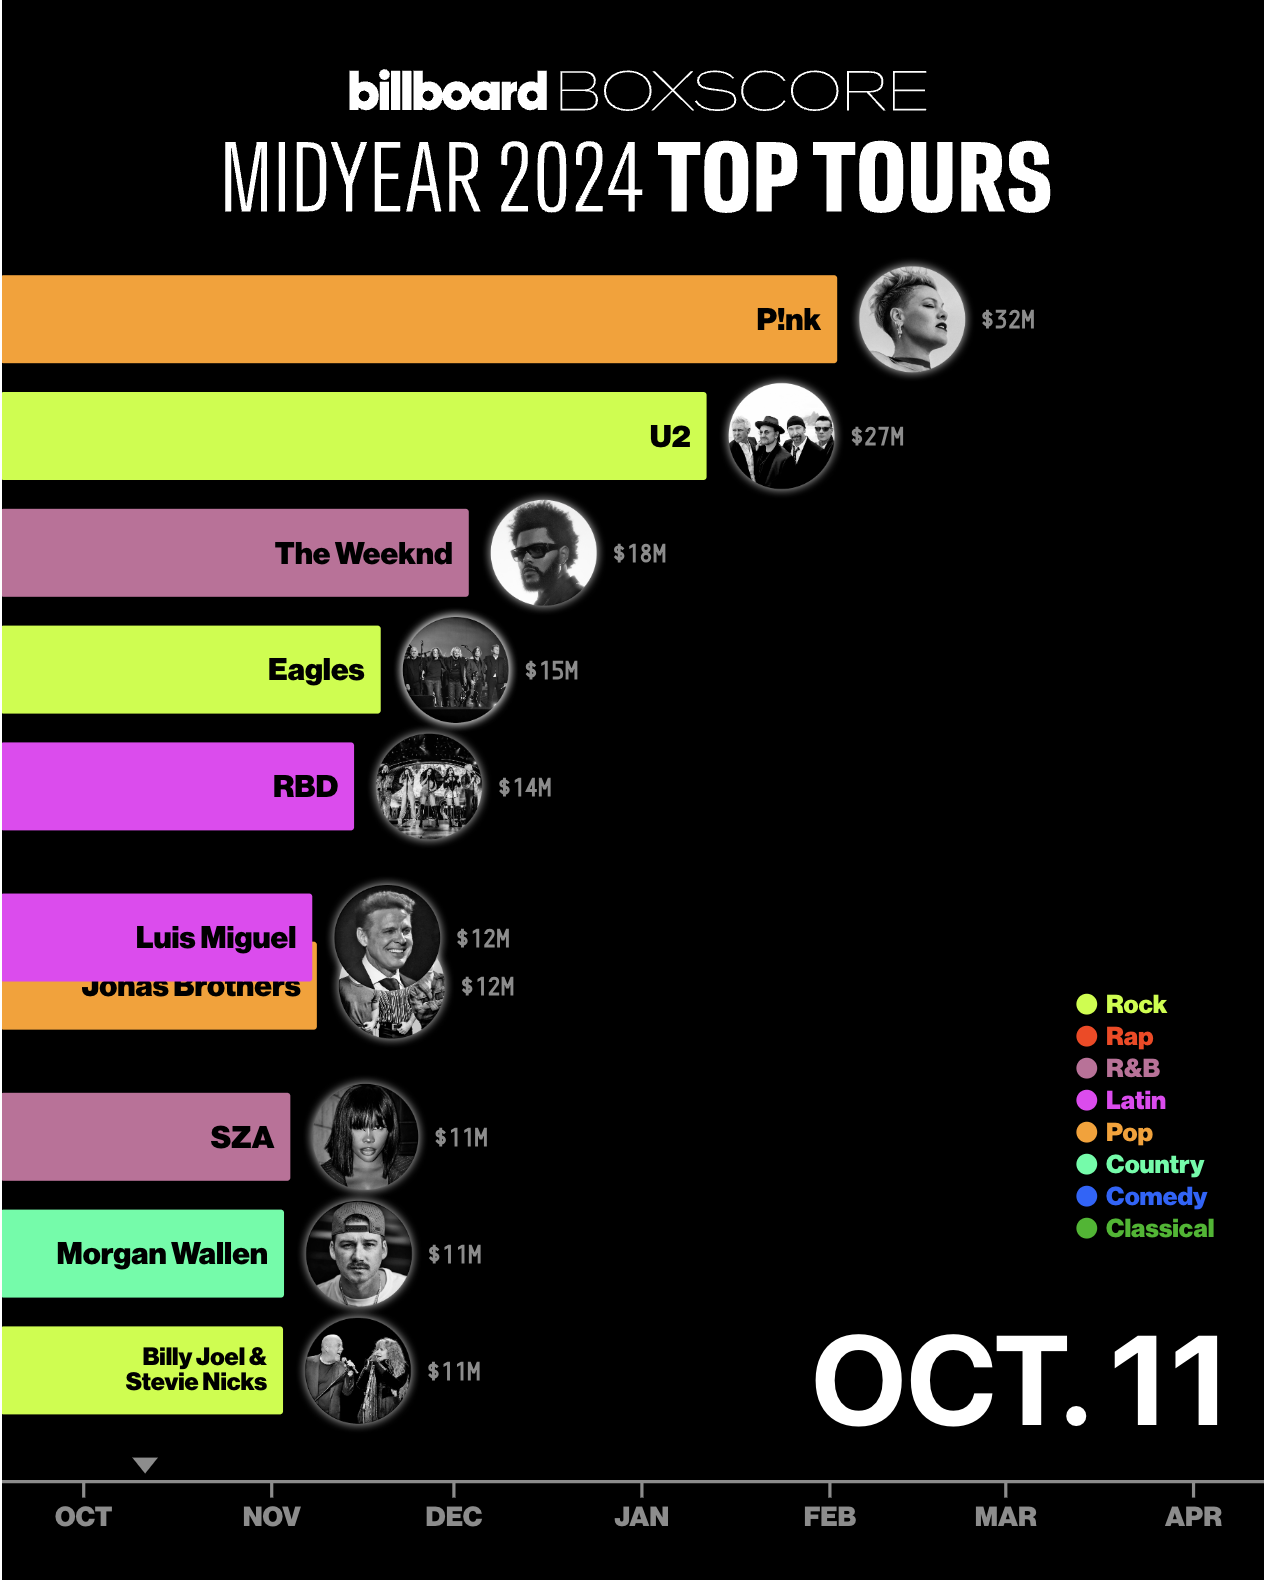
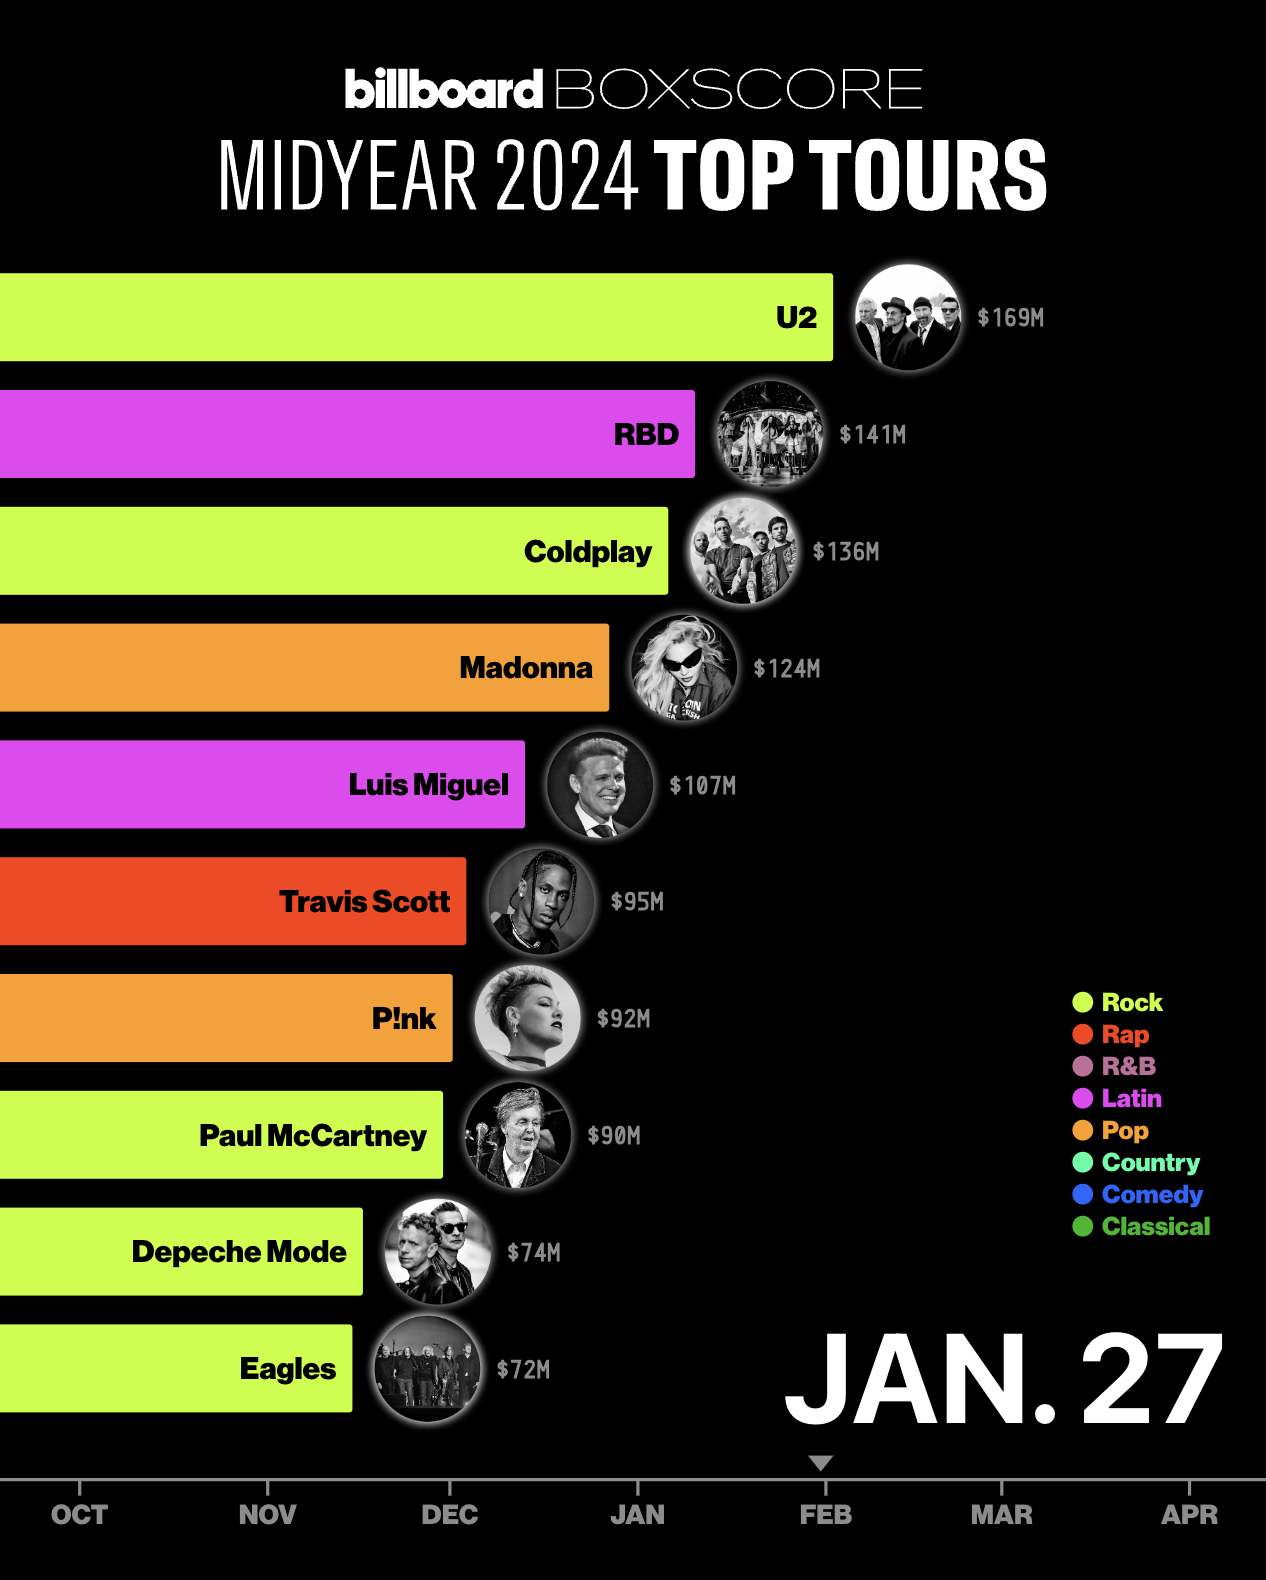
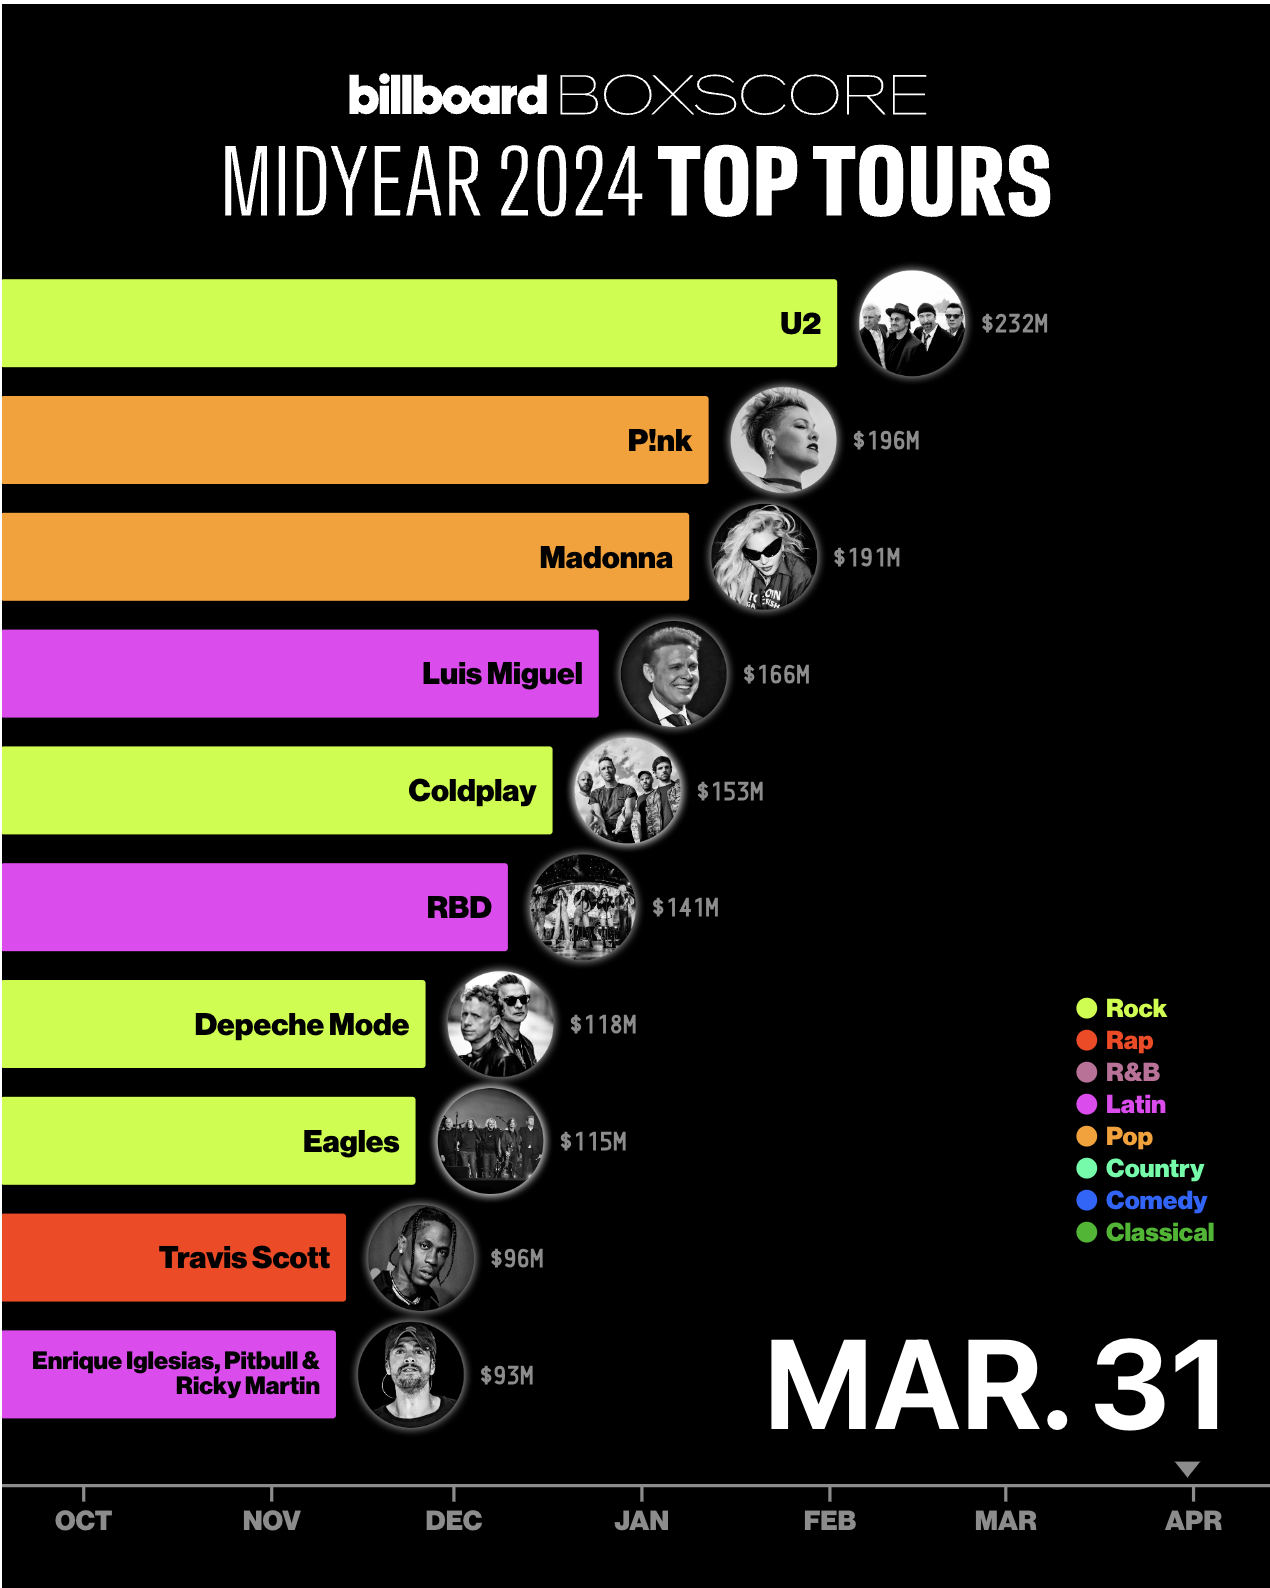
This interactive data visualization uses a bar chart race animation to showcase the evolution of the top-grossing tours on Billboard Boxscore from October 1, 2023, to March 31, 2024. As users engage with the animation, they can watch the rankings of major artists like Madonna, Travis Scott, and U2 shift dynamically over time, highlighting the competition and momentum in the live music industry.
The visualization is designed to provide a clear and engaging breakdown of the leading tours, offering a visually compelling way to explore the data behind the biggest live events of the season. With interactive elements and smooth transitions, this project brings to life the shifting landscape of concert tours and their financial impact.
Tech stack
- ObservableHQ
- D3.js
- Javascript
- HTML/CSS