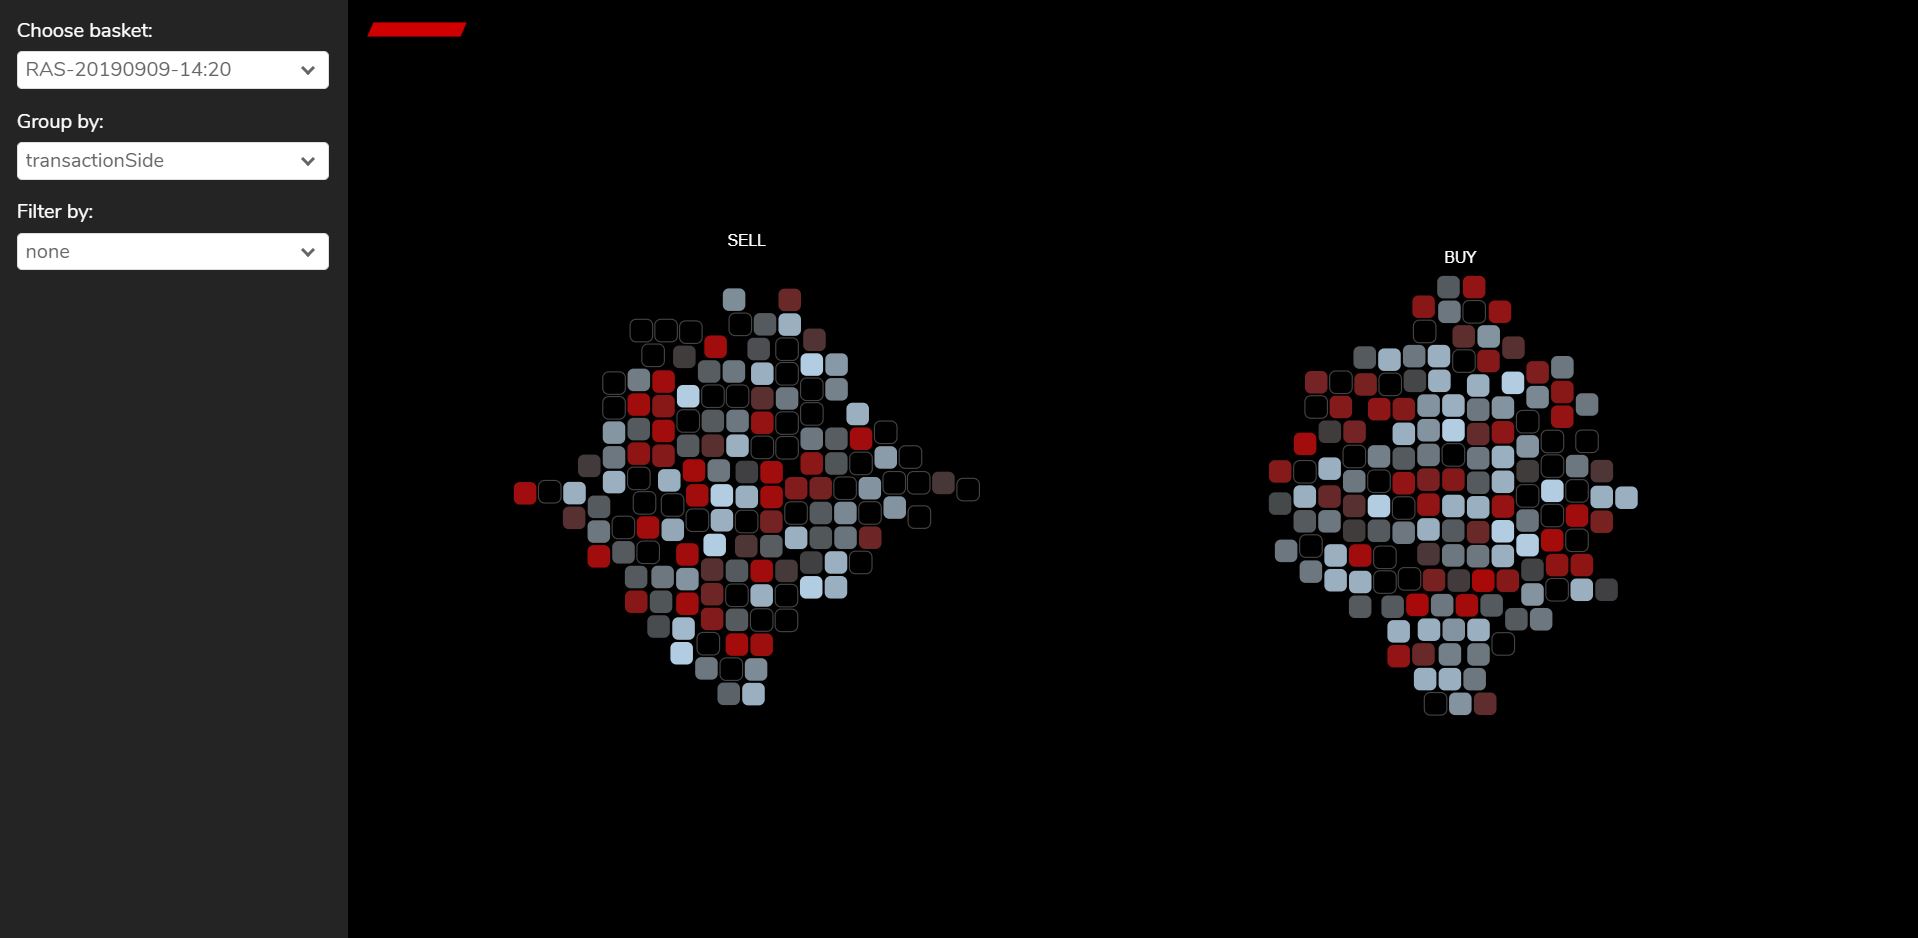
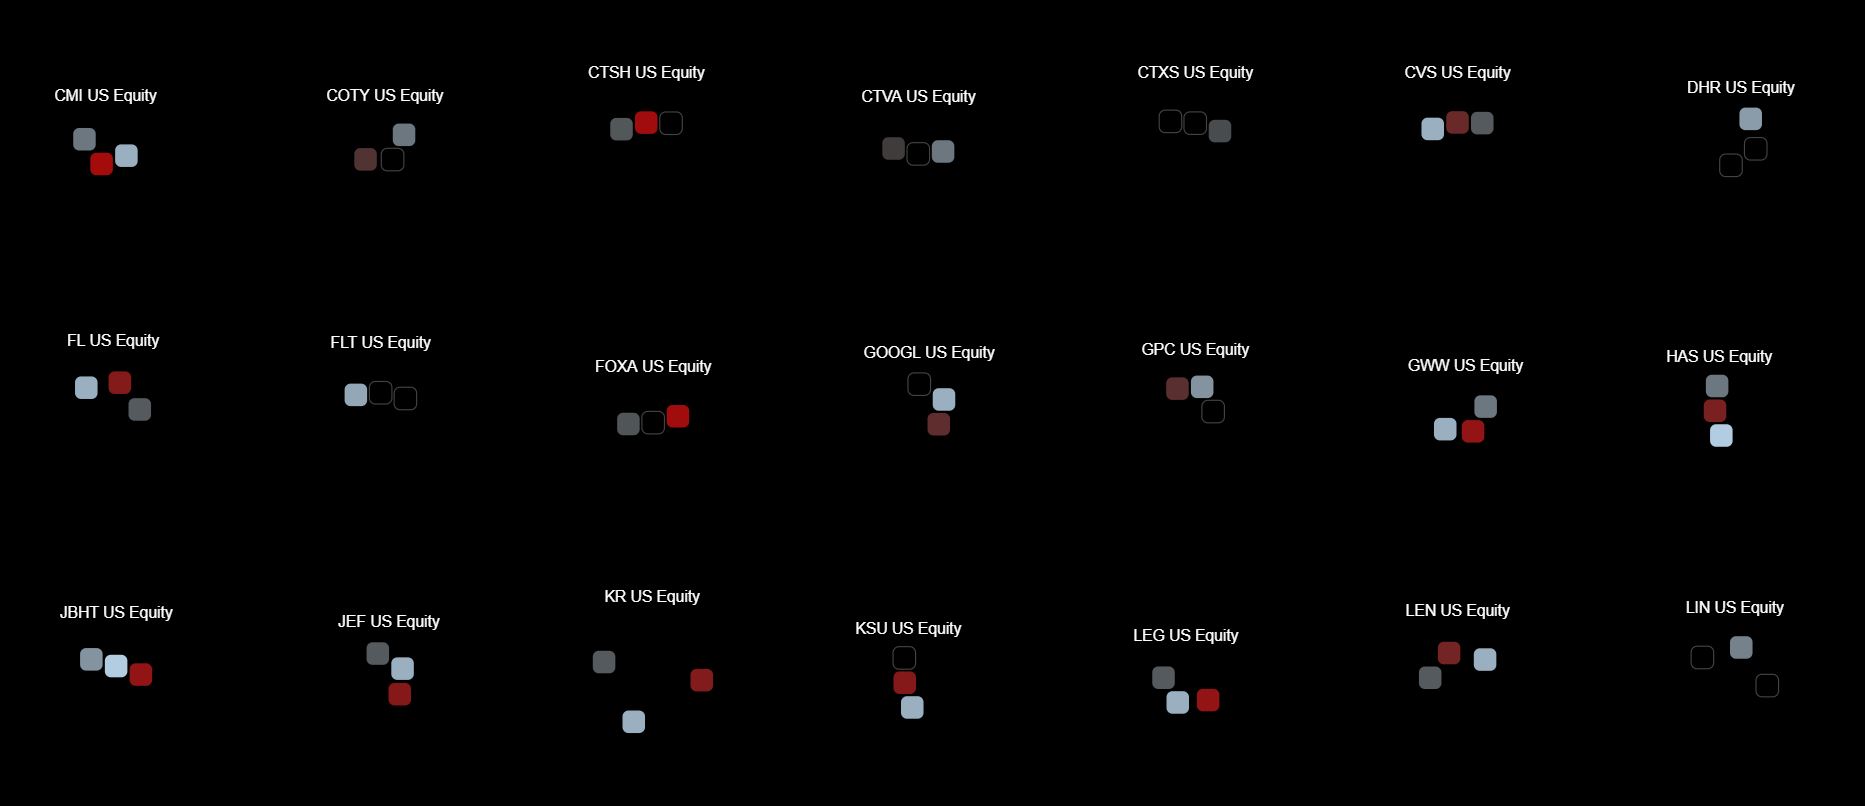
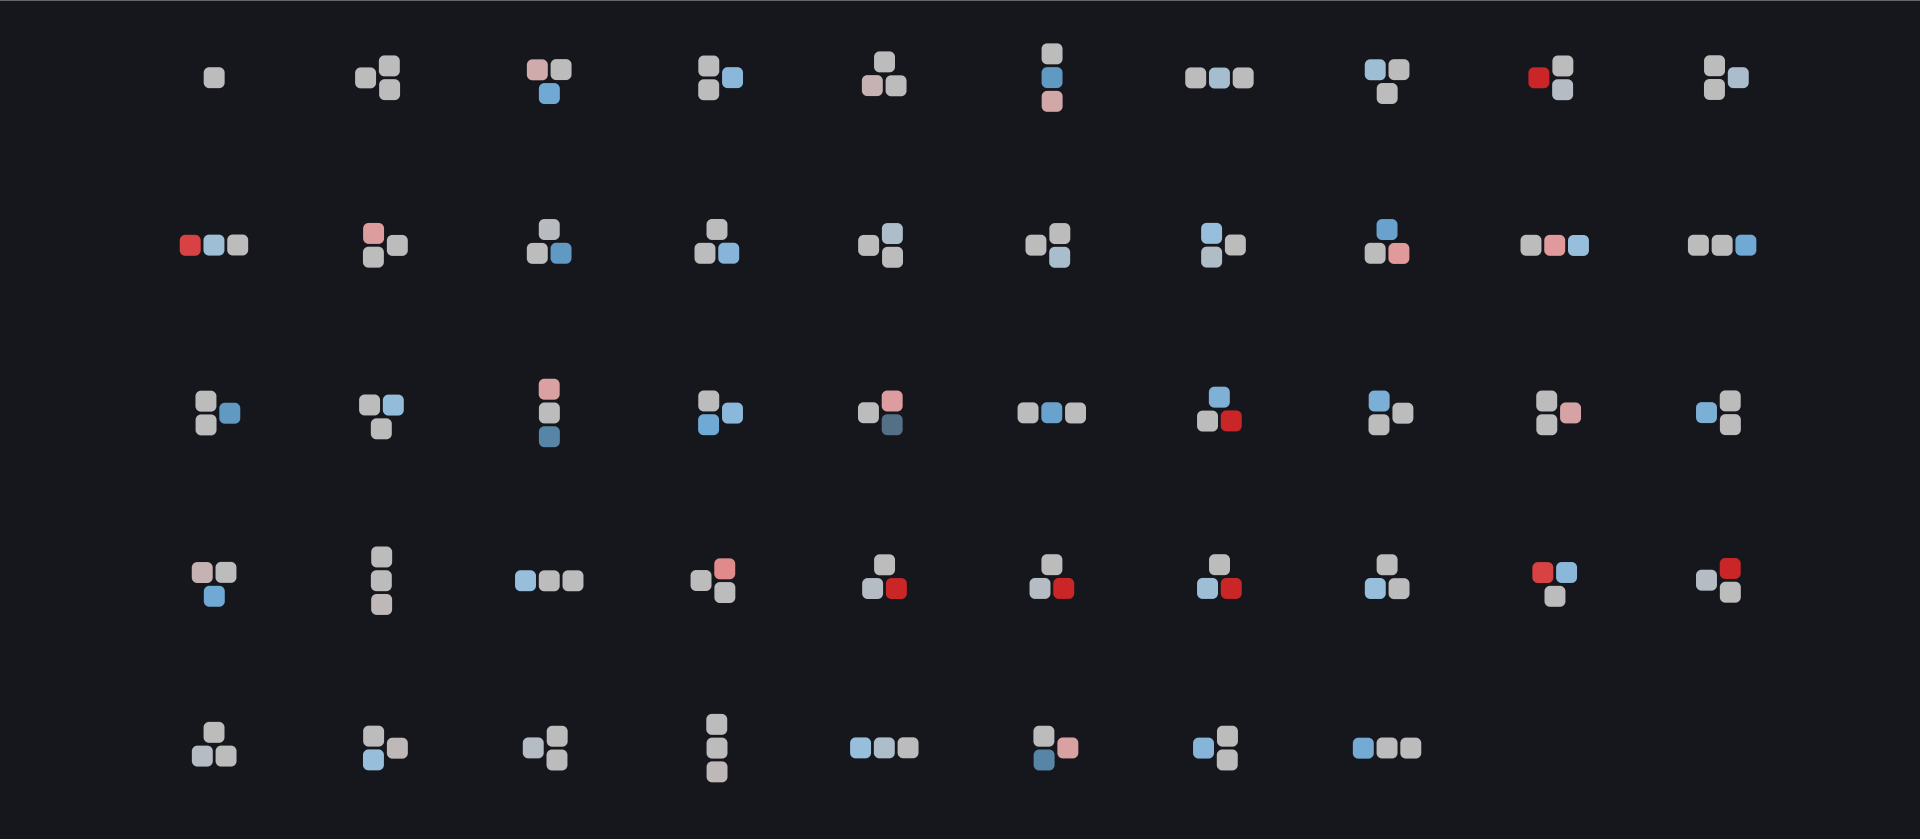
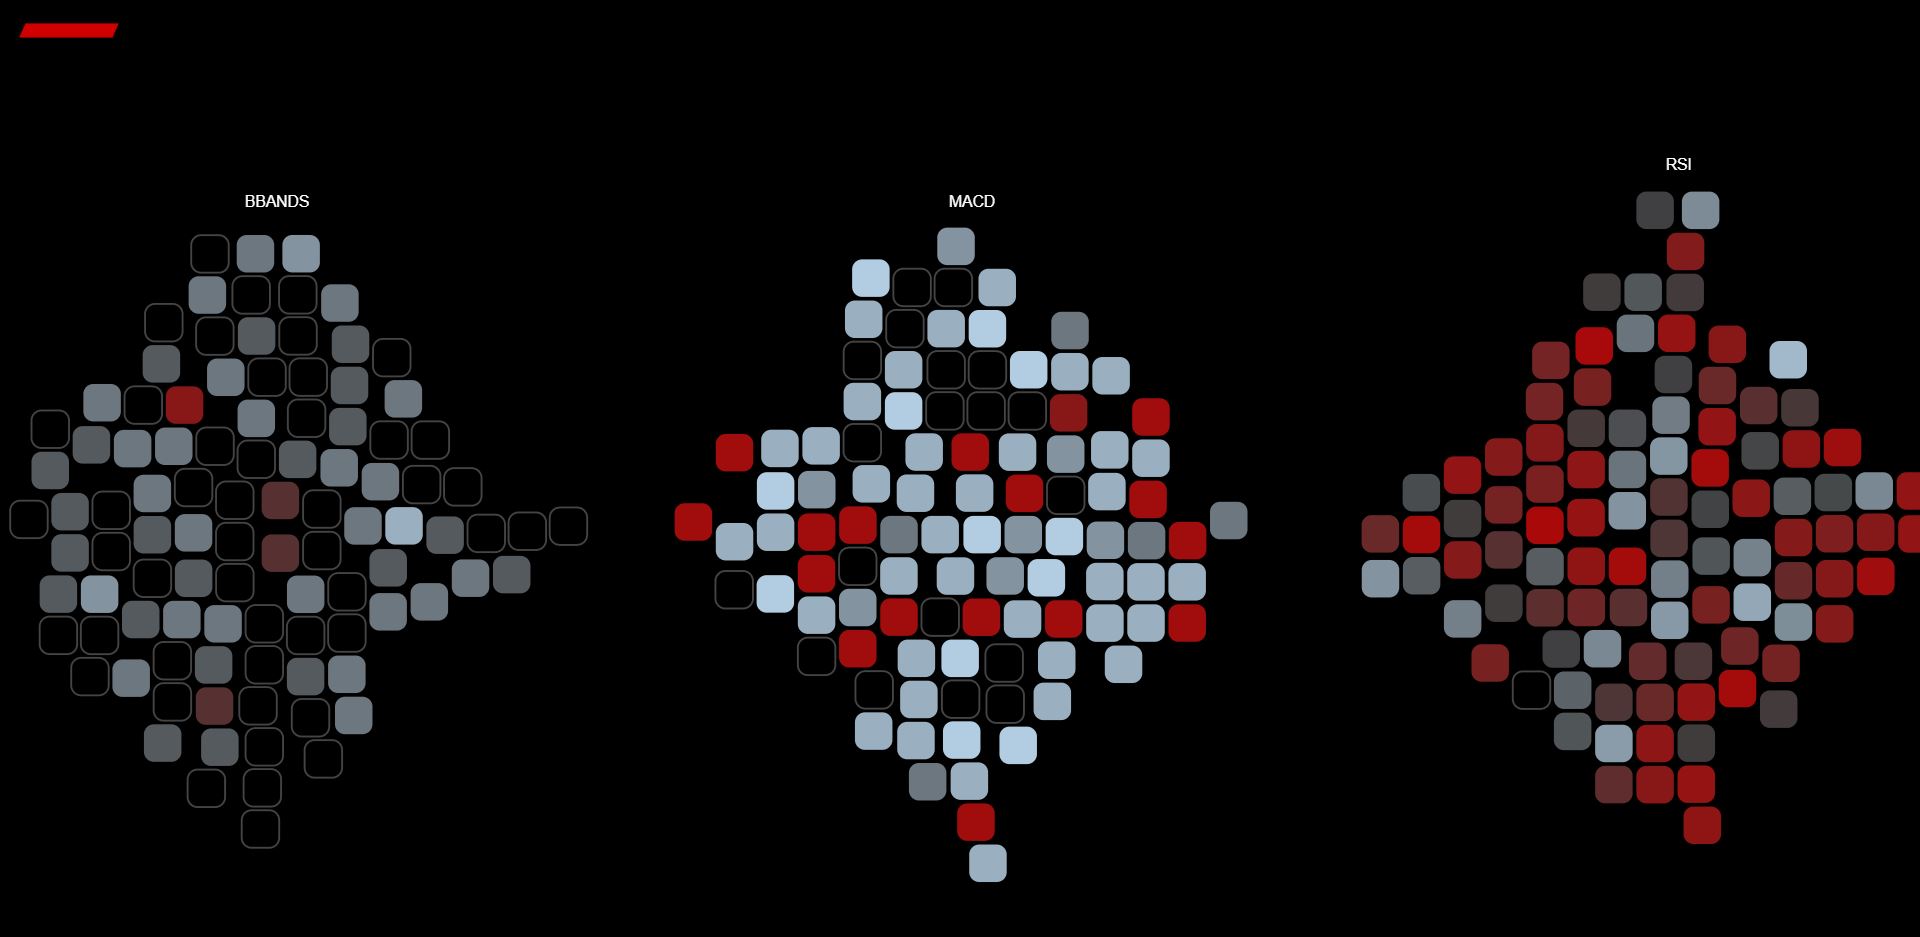
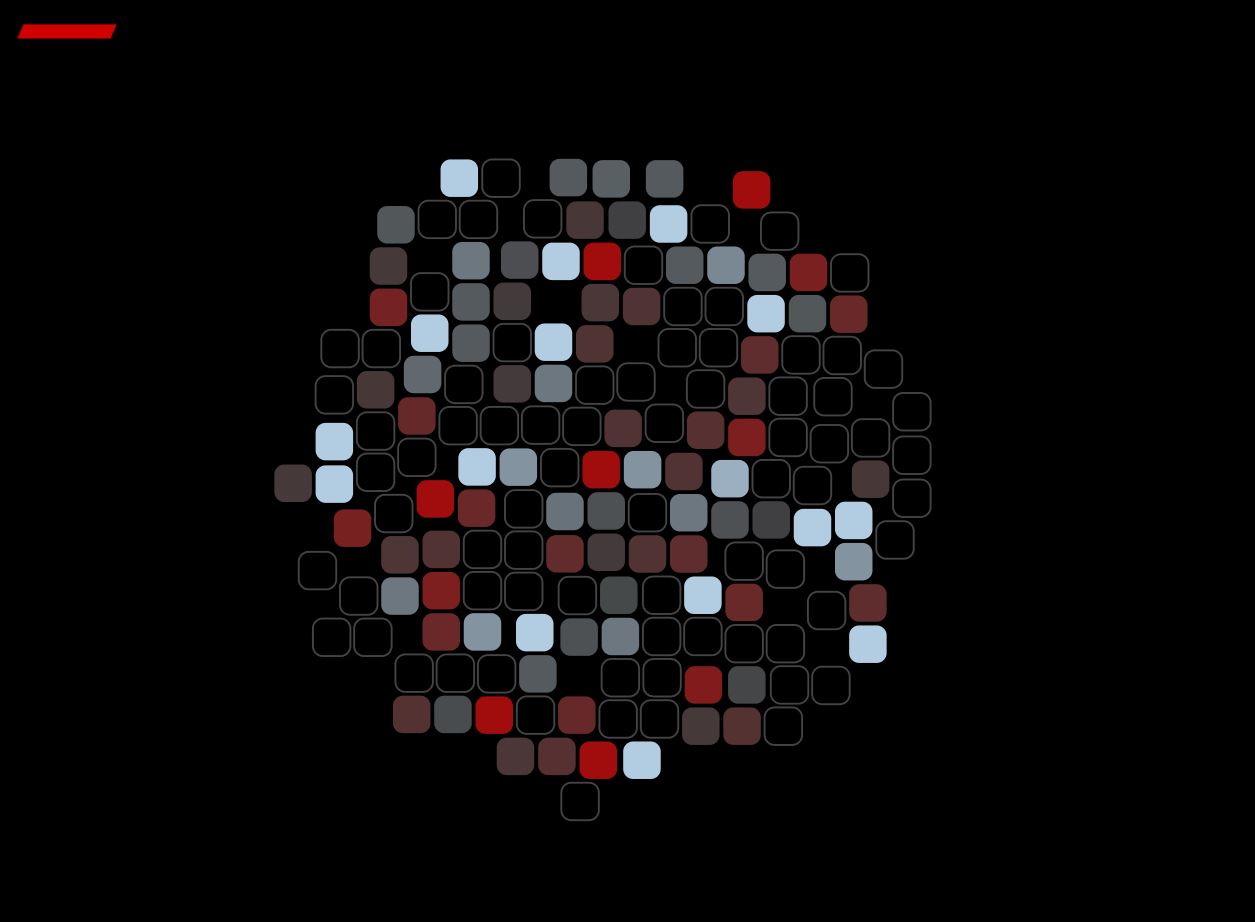
Alis Blocks
Signal Strength Visualization Tool
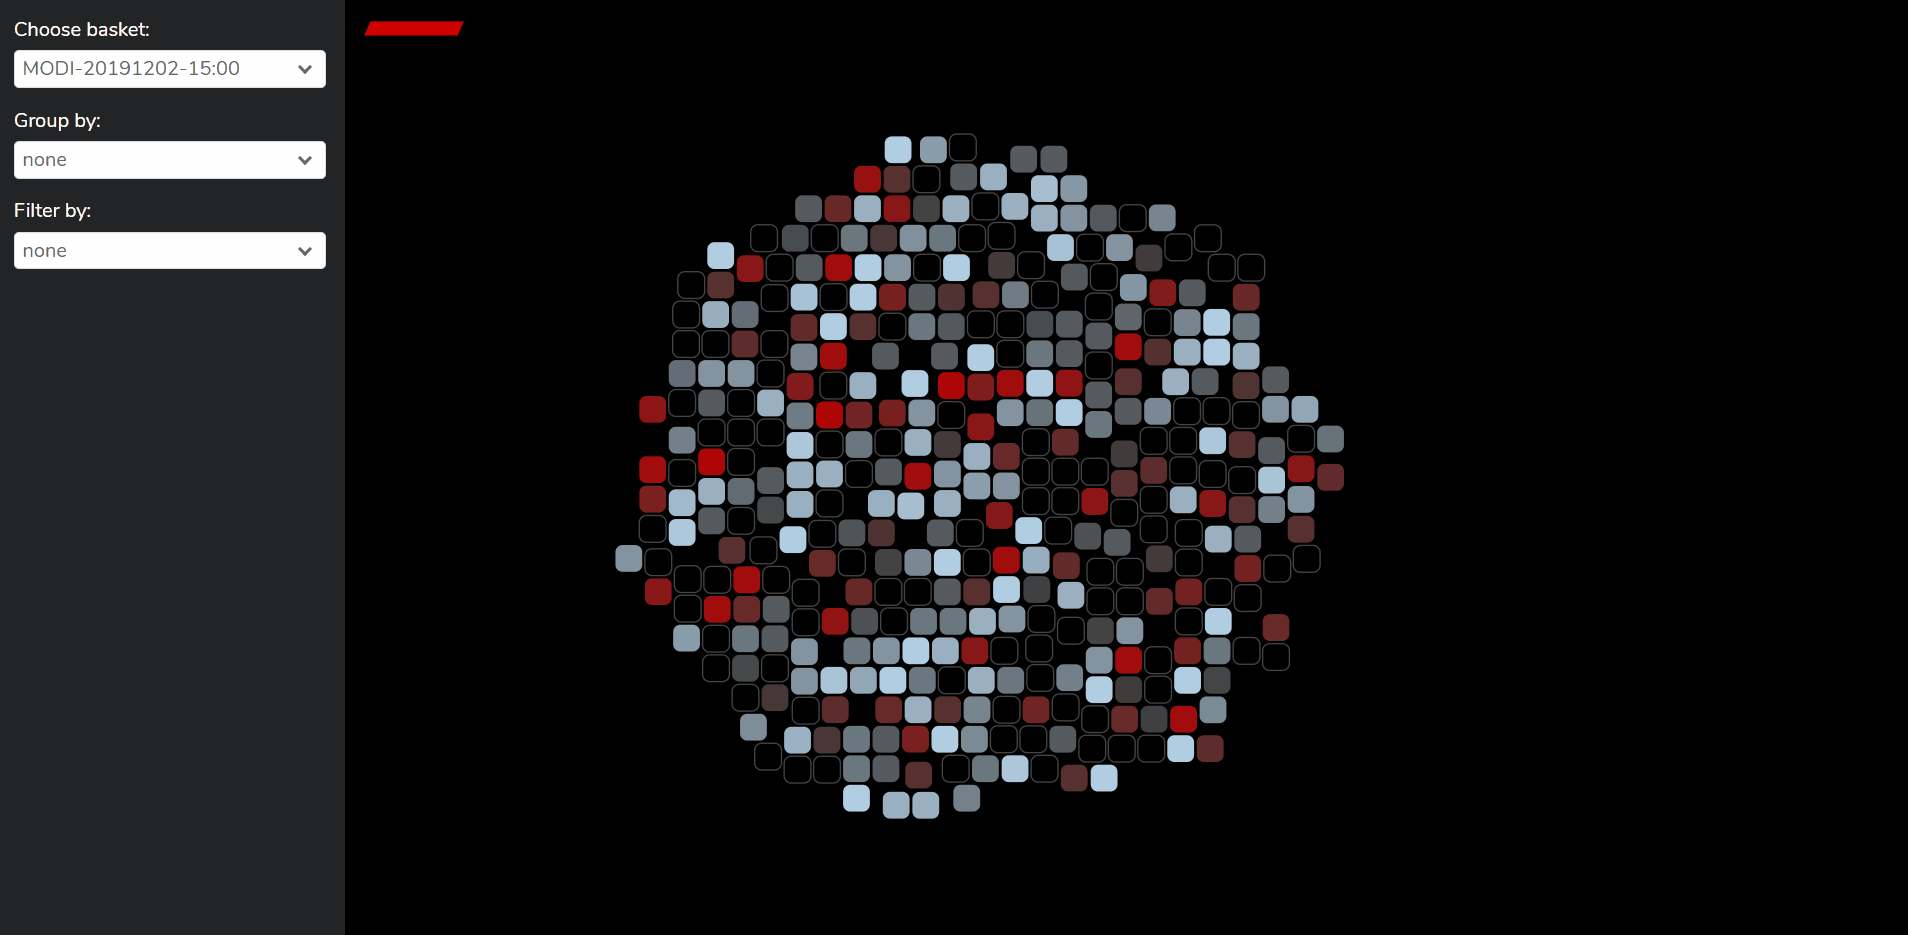
Overview
- Function: Visualizes signal strength using color-coded blocks.
- Color Coding: Ranges from red (indicating 0 or low signal) to light grey (representing 100 or high signal).
Features
- Versatile Grouping: Allows grouping of signal data based on various properties.
- Efficient Filtering: Enables filtering the signal data for focused analysis.
Application
- Useful in network management and analysis for identifying signal strengths and weaknesses.
- Ideal for telecom operators and IT professionals to optimize network performance.
Tech stack
- D3-force
- D3.js
- Firestore
- Google cloud
- Javascript
- HTML/CSS