ML Visualization
Visualization of Machine Learning Models
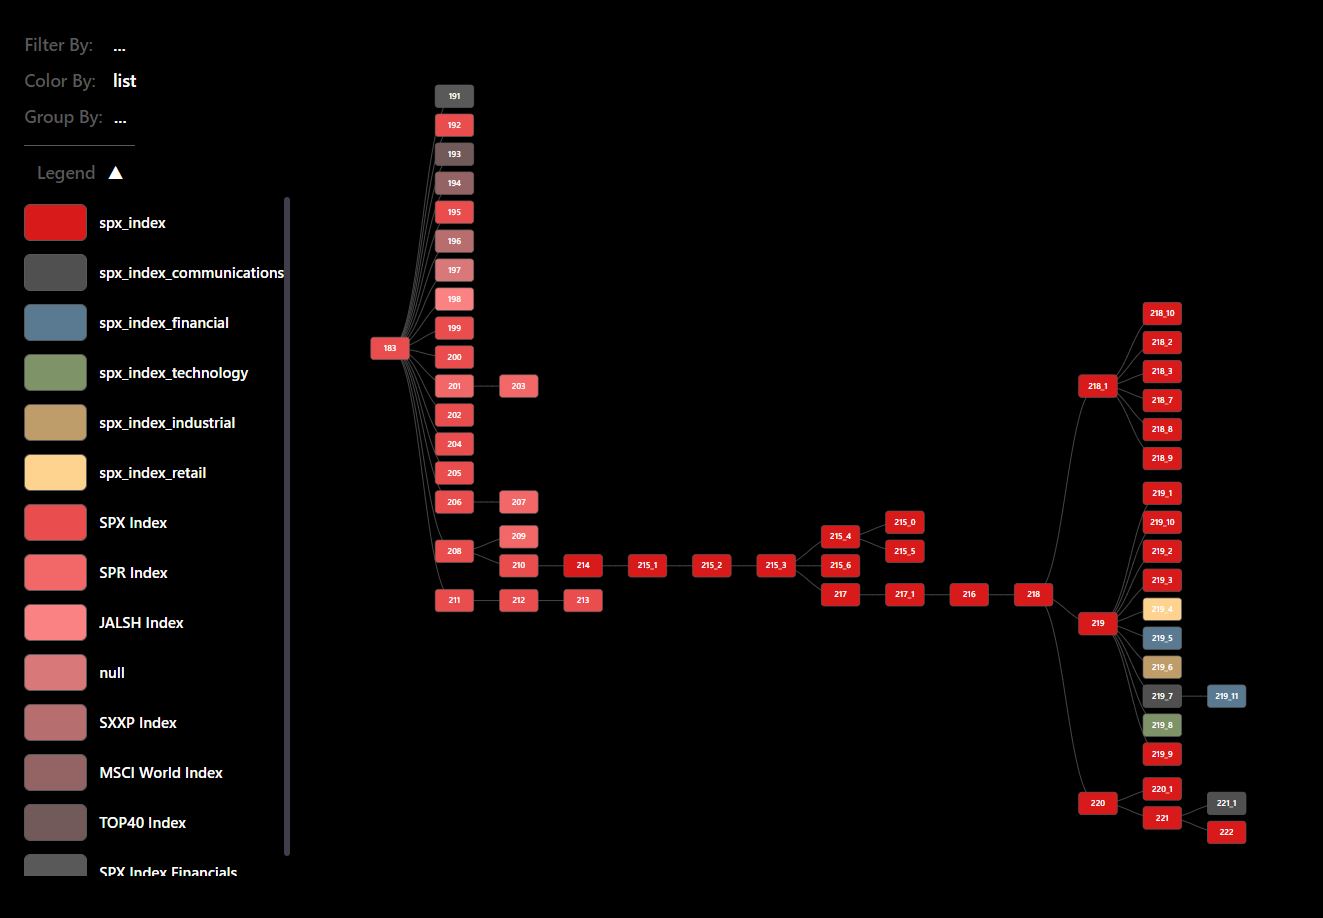
I developed an innovative visualization for alis.
Dynamic Tree Chart Design:
- Each node represents an individual machine learning model.
- Links indicate connections to parent models.
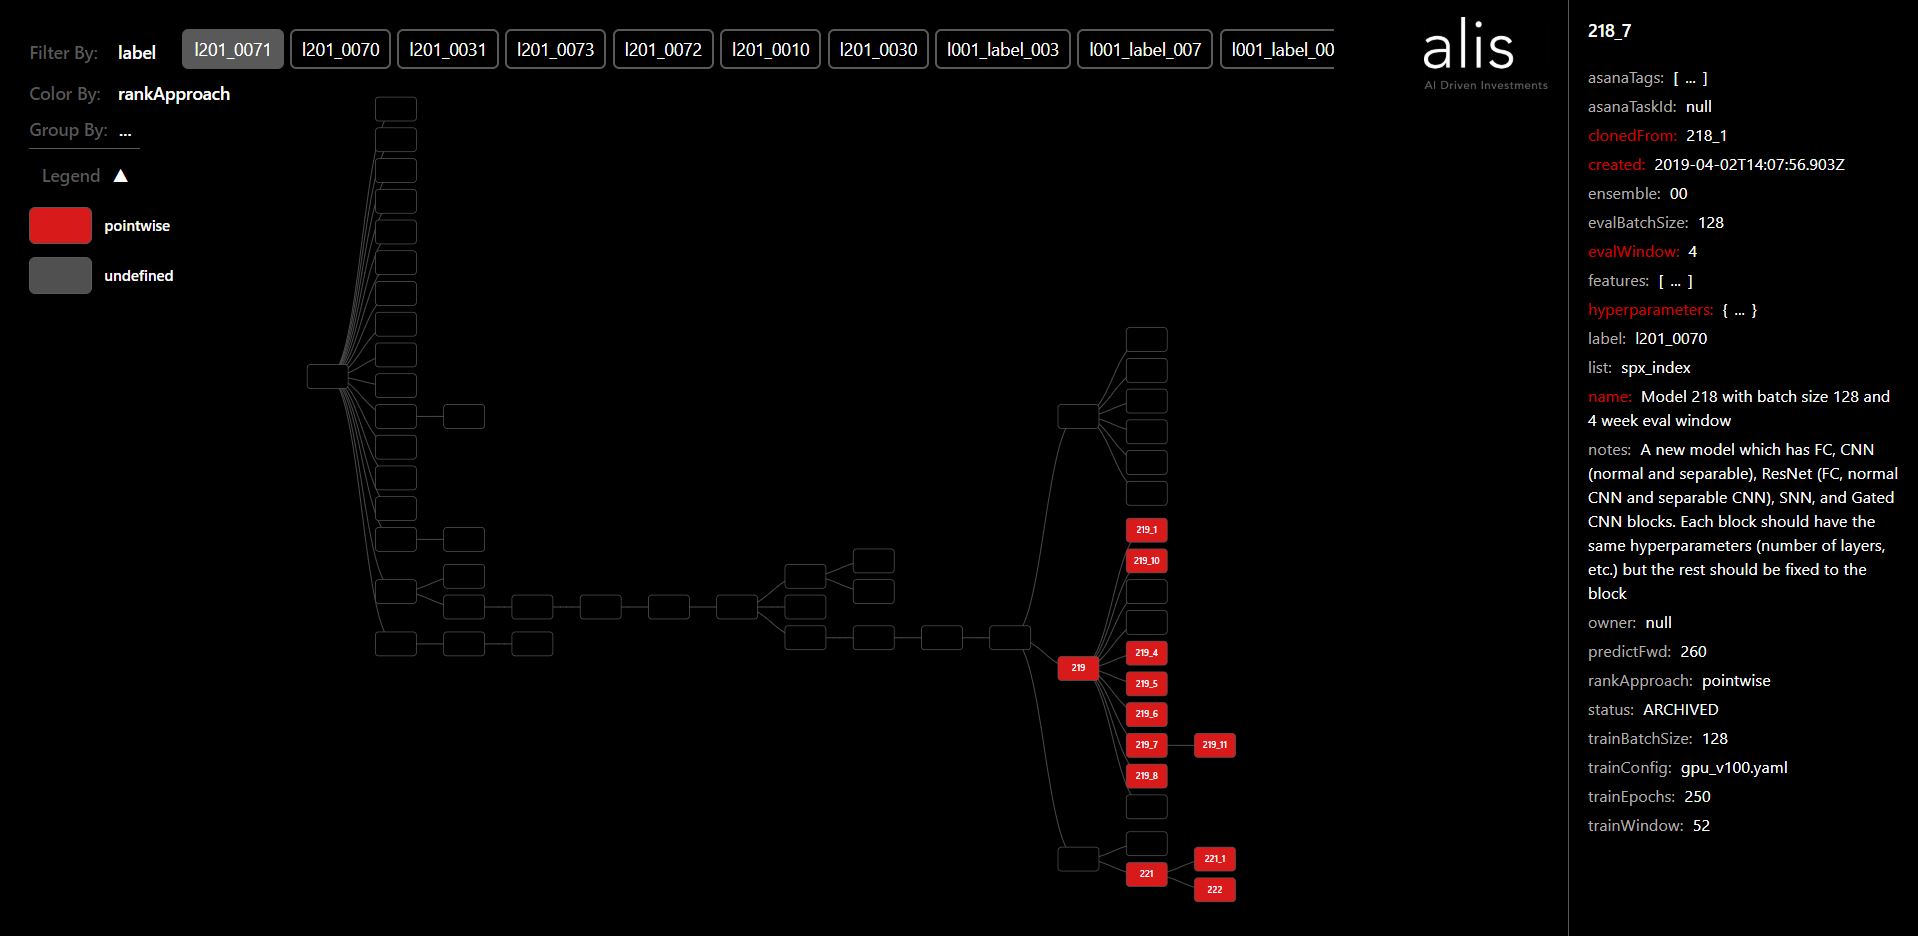
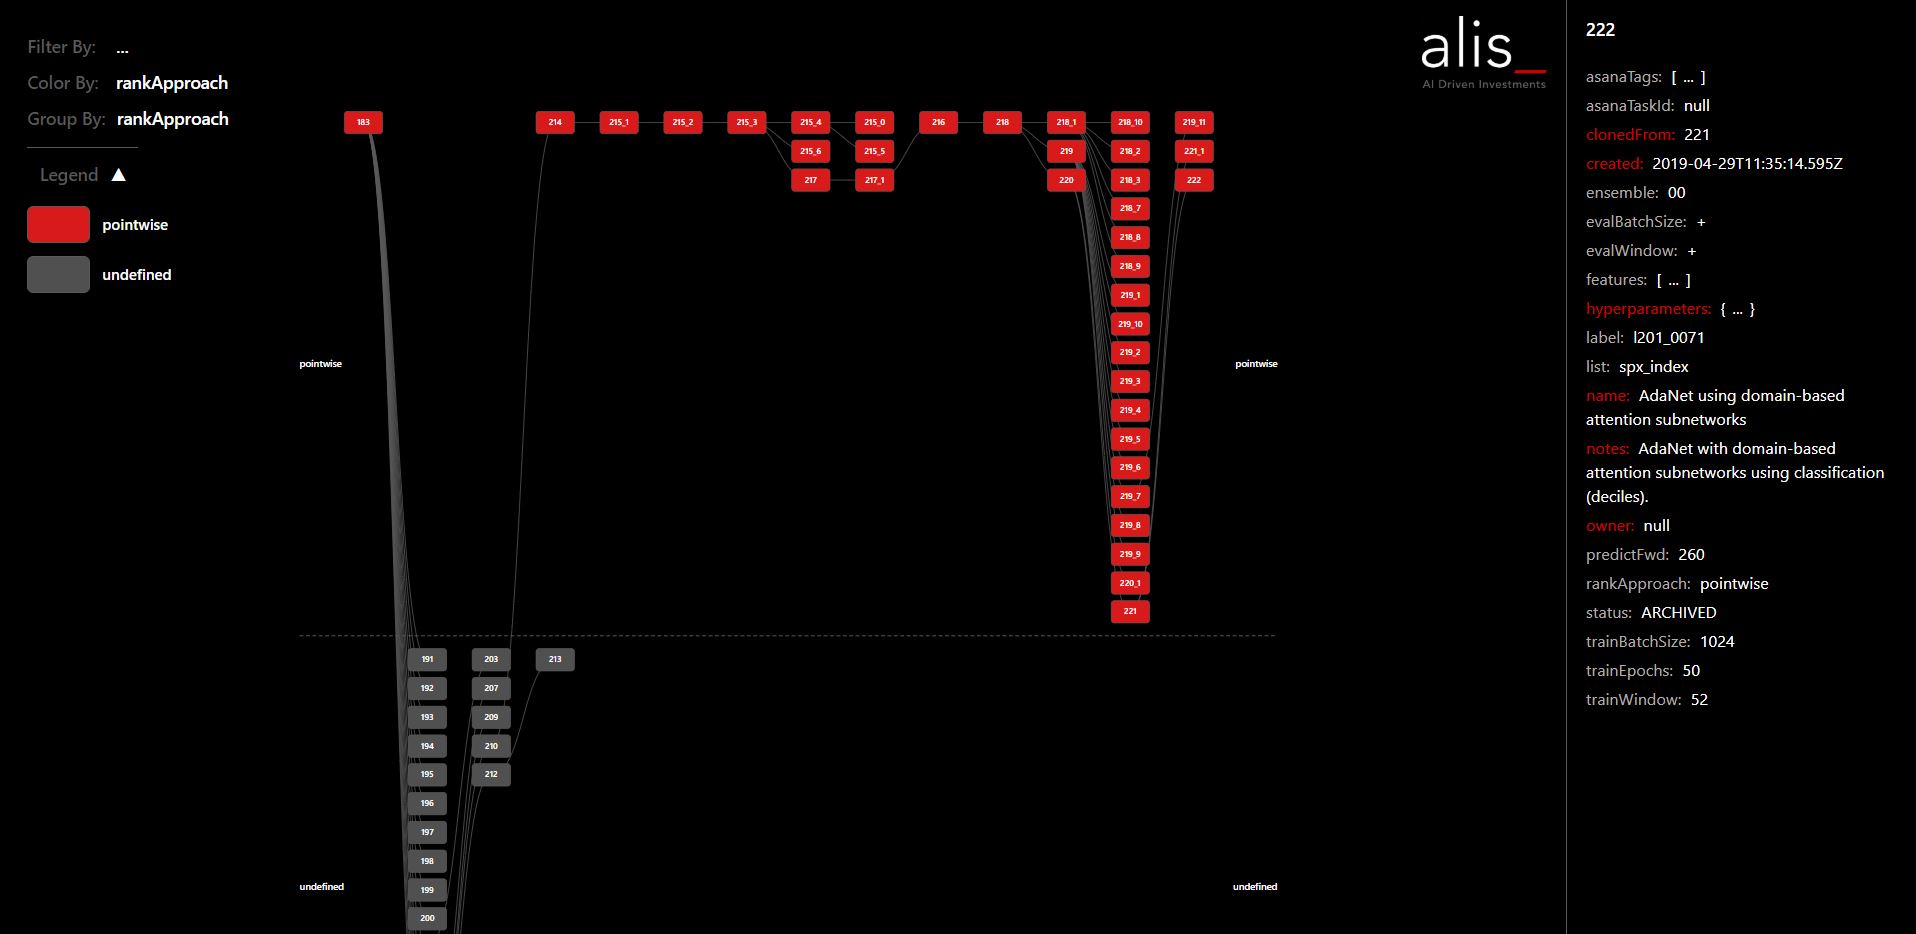
- Interactive features: grouping, filtering, and color-coding based on various attributes.
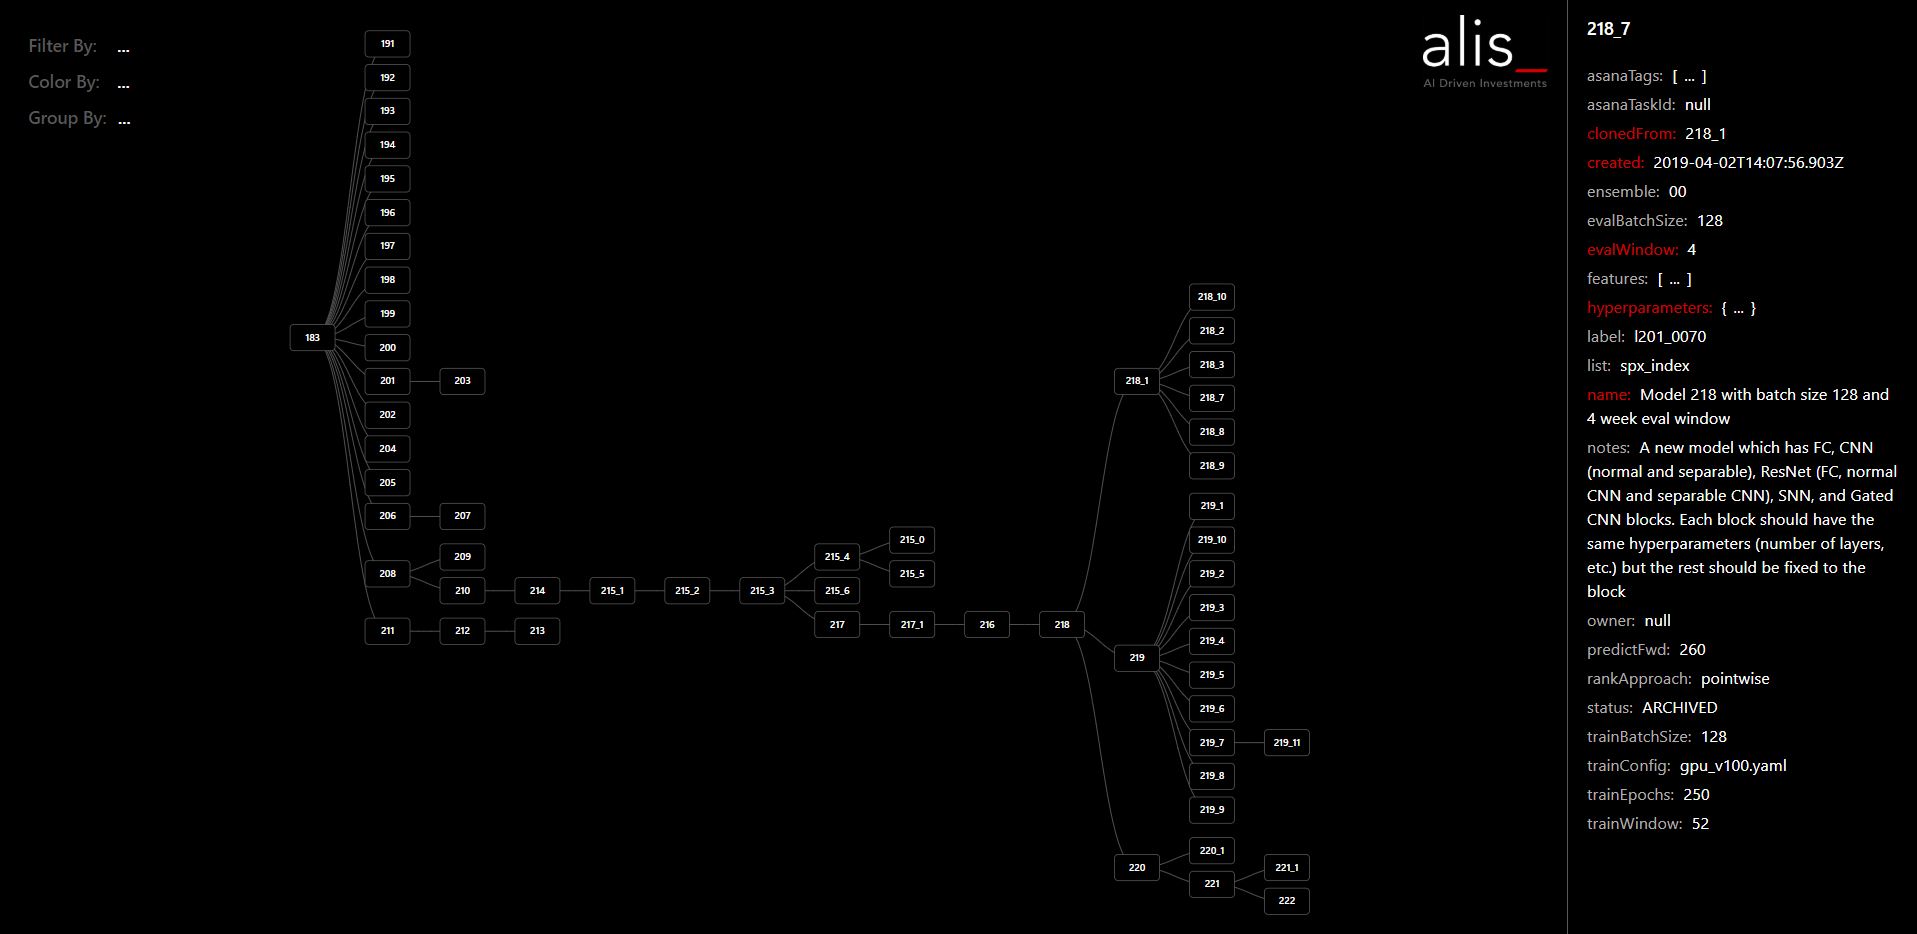
Information Panel:
- Located on the right side of the chart.
- Provides detailed insights into each model.
- Includes comparisons with parent models.
Real-Time Updates:
- Chart dynamically updates with every change in the database.
User Interaction:
- Ability for users to edit attributes directly from the sidebar.
Tech Stack:
- D3.js, D3-hierarchy
- Firestore Firebase
- Google Cloud Engine
- Socket.io
- Node.js